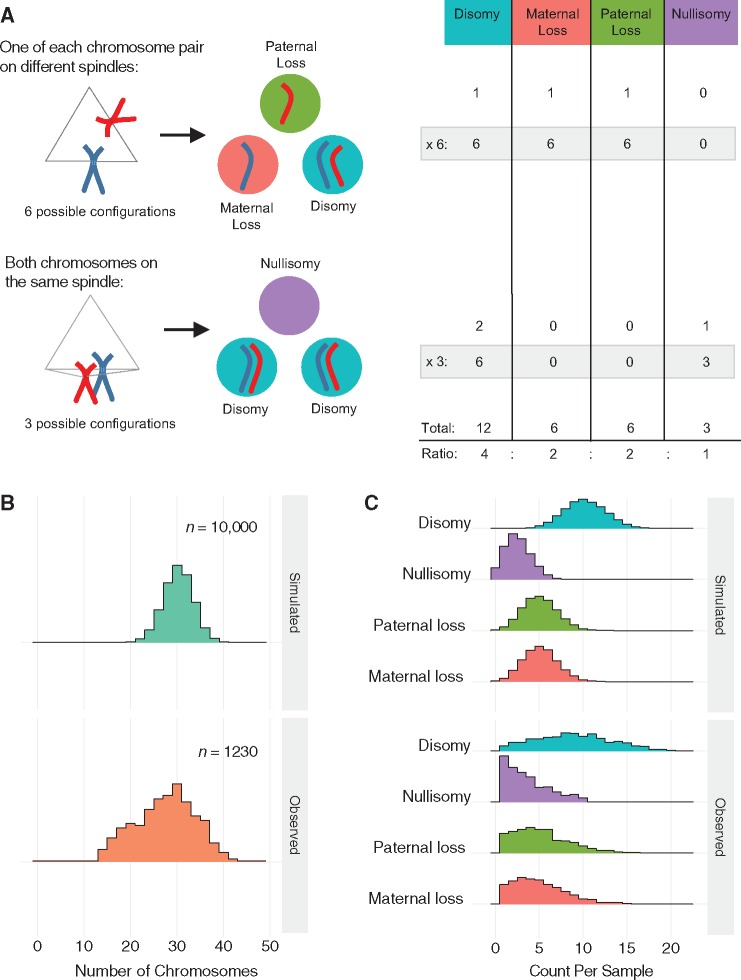
Figure 2.
Tripolar mitosis in diploid embryos. (A) Schematic showing all possible outcomes following diploid tripolar mitosis. Only one pair of chromosomes is depicted for clarity (maternal: red; paternal: blue). Spindle attachment configurations are shown on the left with segregation outcomes in the three daughter cells shown in the middle. The table on the right provides the expected ratios of segregation outcomes for each chromosome following tripolar mitosis. (B) Density histograms showing observed chromosome counts in 1230 samples that are suspected to have undergone tripolar mitosis (see main text) compared with 10 000 samples simulated under a model of random tripolar segregation. Observed peaks at ∼30 and ∼20 chromosomes may reflect one and two rounds of tripolar mitosis, respectively. (C) Density histograms displaying the number of chromosomes in each biopsy displaying each of the four possible outcomes. Simulated data (10 000 simulations) are displayed in the top panel, while observed data (1230 putative diploid tripolar biopsies) are displayed in the bottom panel.

