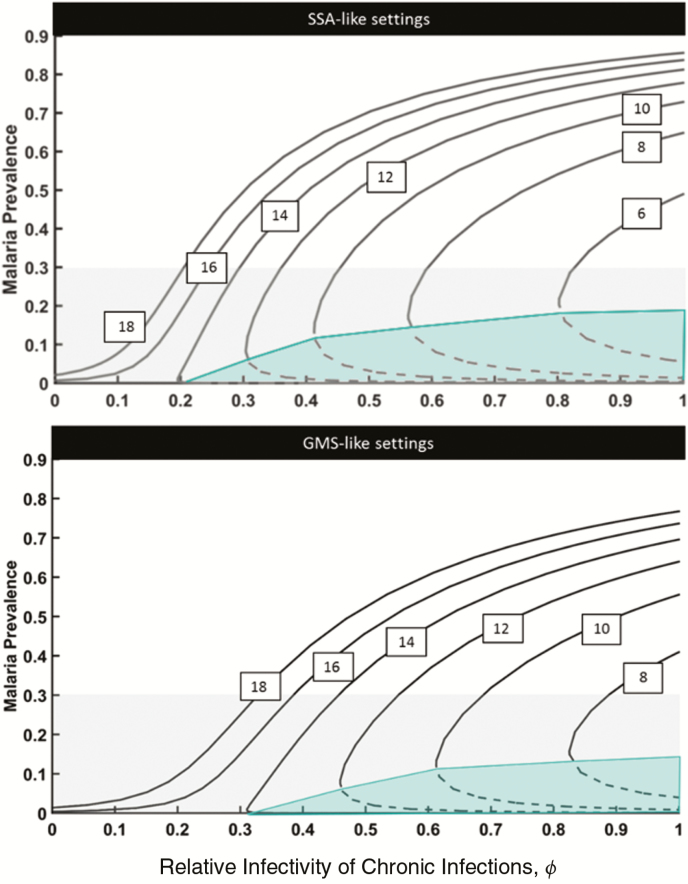
Figure 1.
Malaria equilibrium prevalence for different combinations of vectorial capacity (VC) and relative infectivity of chronic infections. Curves from left to right represent decreasing values of VC (18, 16, 14, 12, 10, 8, and 6 infectious bites per year) as indicated in the text boxes. Dashed lines reflect unstable equilibrium solutions (ie, elimination thresholds; solid lines, stable equilibrium solutions). The grey area illustrates the lower end of the malaria transmission spectrum which is usually deemed “controllable.” The green area delimits areas of unstable malaria transmission where malaria is expected to be eliminated over time without additional control measures. Abbreviations: GMS, Greater Mekong Subregion; SSA, sub-Saharan Africa.

