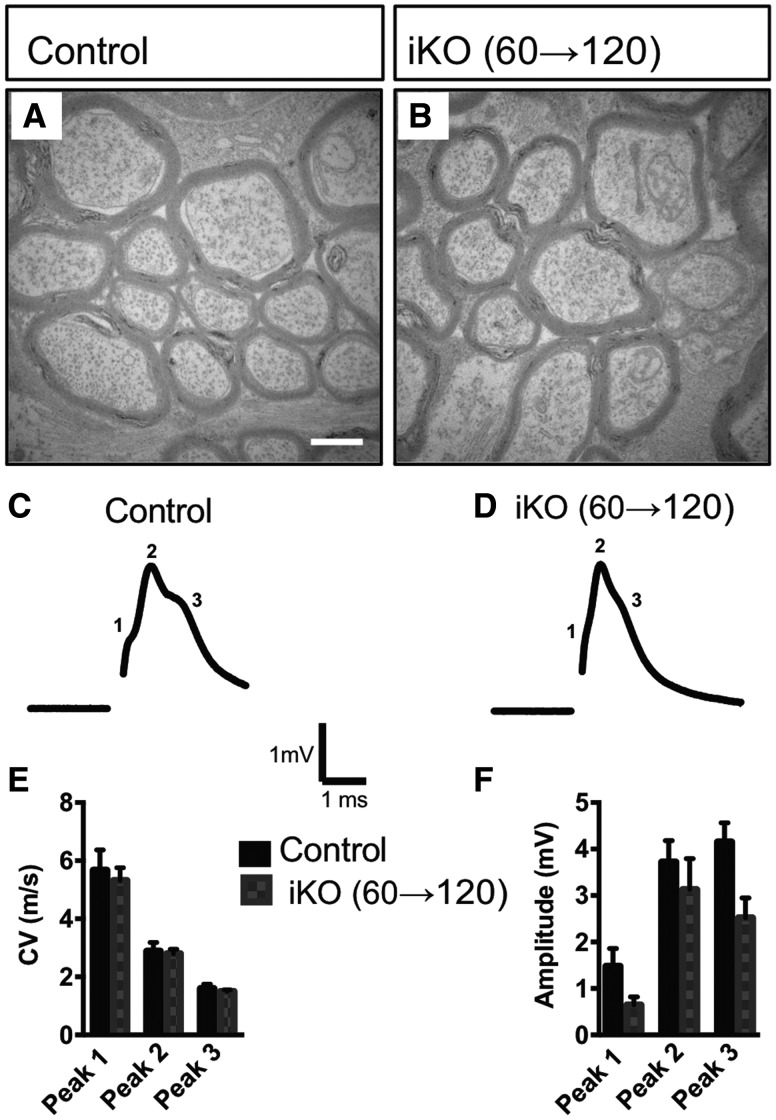
Figure 5.
Optic nerve ultrastructure and conduction are not affected in adult Fig4 iKO60d mice. (A, B) Representative TEM optic nerve cross section micrographs of adult Fig4 control and iKO(60→120) mice. Scale bar = 1 μm, n = 4 mice per genotype. (C, D) Representative optic nerve CAP traces recorded from adult Fig4 control and iKO(60→120) mice show three characteristic peaks. (E) Quantification of conduction velocities and (F) amplitudes for each peak within CAP traces identified by Gaussian fit. Data are shown as mean ± SEM. Multiple unpaired Student t-tests, n = 5 nerves (Fig4 control), n = 6 nerves (iKO).

