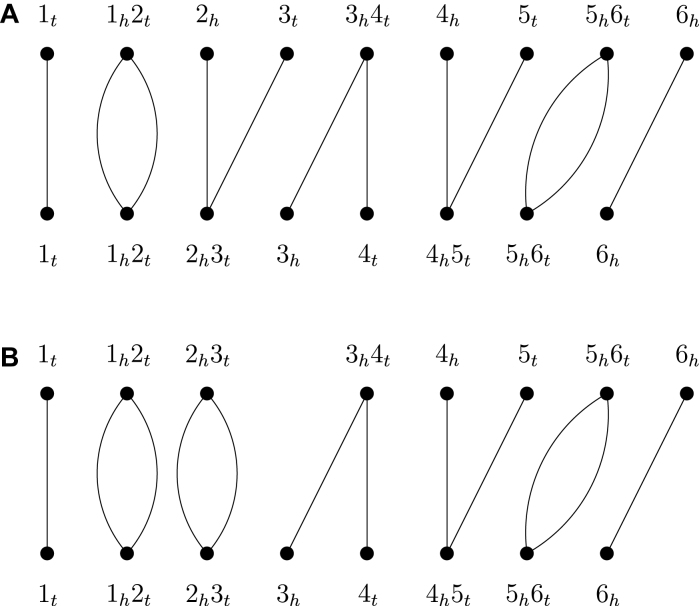
Figure 1.
(A) Adjacency graph between two sets of contigs π = {[1, 2], [3, 4], [5, 6]} and σ = {[1, 2, 3], [4, 5, 6]}, where the top vertices of the graph correspond to the adjacencies and telomeres in π and the bottom vertices correspond to the adjacencies and telomeres in σ. (B) The resulting adjacency graph after two contigs [1, 2] and [3, 4] in π are joined into a scaffold [1, 2, 3, 4].

