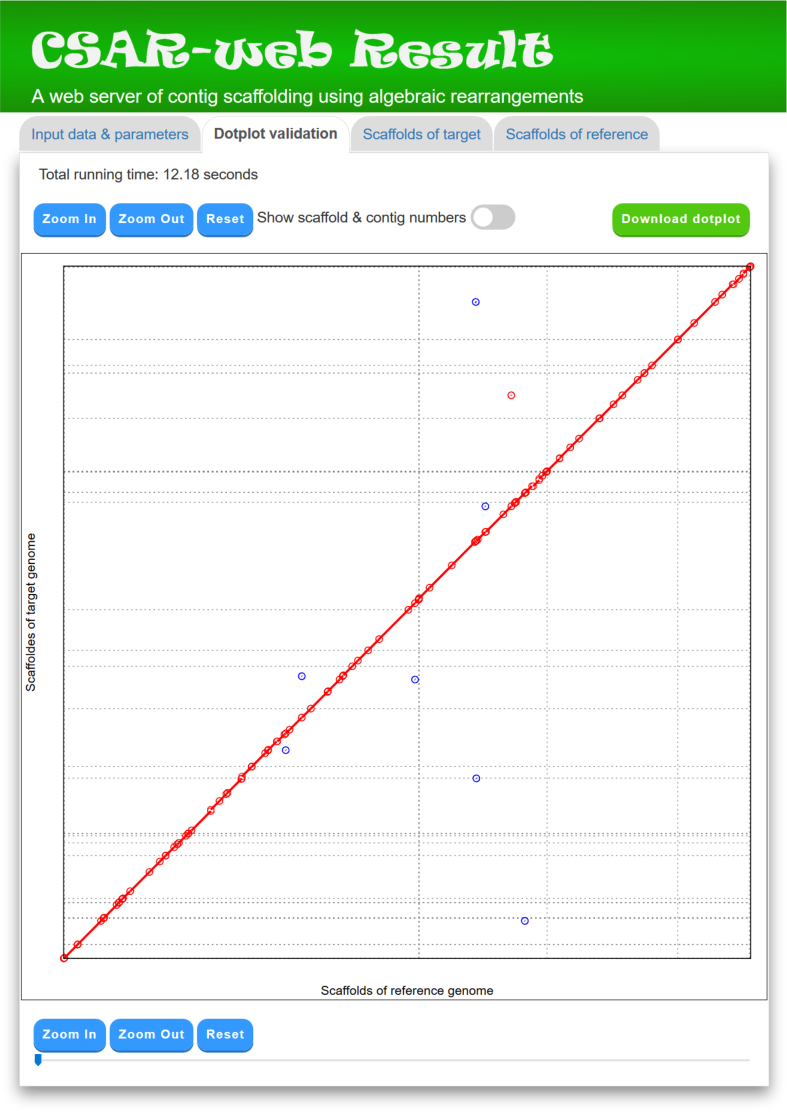
Figure 4.
A display of ‘Dotplot validation’ tab page. Many single unfilled dots in Figure 3 present at the ends of contigs (i.e. at the contig boundaries) and they disappear in this figure because their contigs are scaffolded well according to the reference genome. The remaining single unfilled dots in this figure actually occur within the contigs, which may be due to the existence of small rearrangements between target and reference genomes or simply errors made in the process of contig assembly.

