Figure 1.
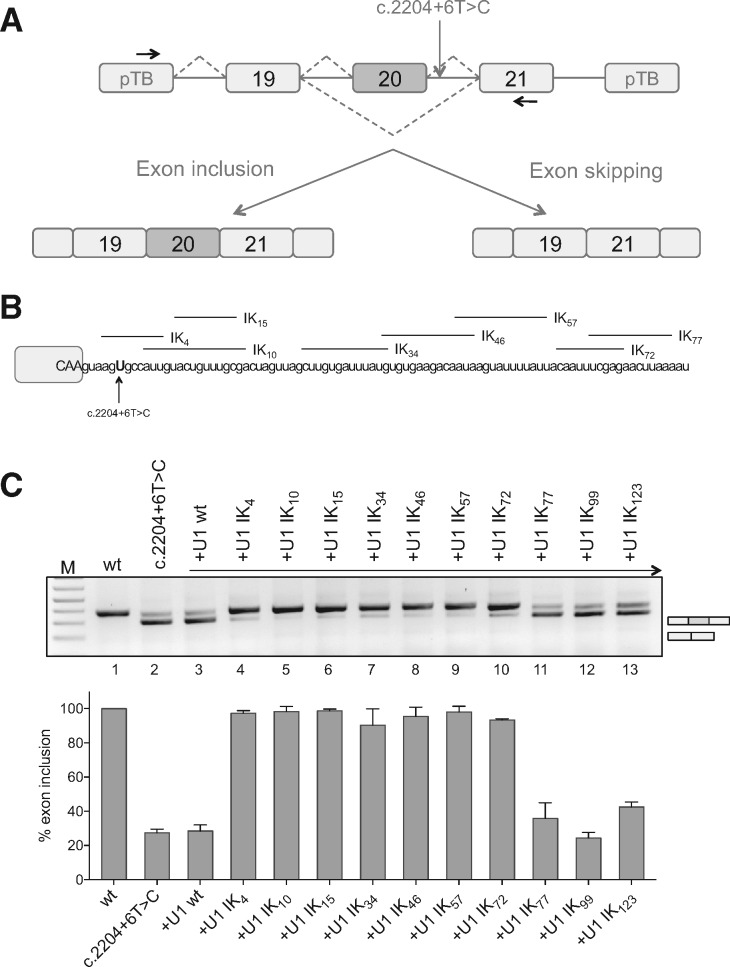
ExSpeU1s correct the FD splicing defect in an in vitro splicing assay. (A) Schematic representation of the ELP1 minigenes. Boxes represent exons and lines introns. The intronic C.2204+6T>C mutation is indicated. Arrows indicate the locations of the primers used for analysis of splicing products. The two alternative transcripts are indicated below. (B) Schematic representation of the ELP1-ExSpeU1s binding regions in the intronic sequence downstream of the ELP1 exon 20 5′ splice site. Exonic and intronic sequences are in upper and lower cases, respectively. (C) Results of co-transfection, of ELP1 minigenes along with ELP1-ExSpeU1s, in SH-SY5Y cells. The upper band of 349 bp corresponds to transcripts including the exon 20; the lower band of 275 bp to exon 20 skipping. Wild-type ELP1 (wt), mutant (C.2204+6T>C) and ExSpeU1s (Ik4–123) are indicated. A schematic representation of the splicing pattern is on the right of the RT-PCR gel analysis. The graph represents the percentage of exon 20 inclusion and data are expressed as mean±SD of three independent experiments.

