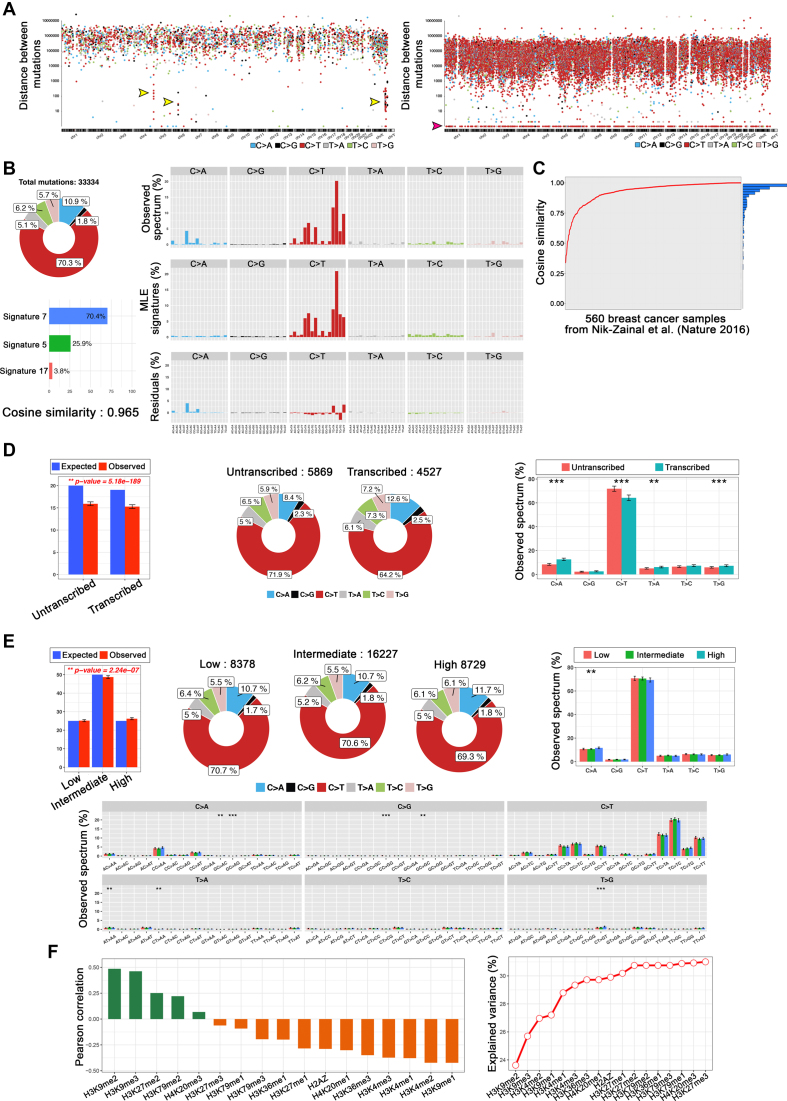
Figure 2.
Mutalisk analysis results: (A) Rainfall plot of lung cancer mutations exhibiting kataegis (left) and melanoma mutations (right). (B) Detailed results of the mutational signature decomposition of the COLO-829 melanoma sample. (C) Cosine similarities between Mutalisk and Nik-Zainal et al. (24) mutational signatures for each of the 560 breast cancer samples. (D) Transcriptional strand bias analysis results of the COLO-829 melanoma mutations. (E) Detailed results of the epigenomic modification analysis of H3K9me3 and the COLO-829 mutations (**P-value < 0.05 and ***P-value < 0.01) and (F) Pearson correlation coefficients and percentages of explained variance for the regulatory elements and the COLO-829 mutations.

