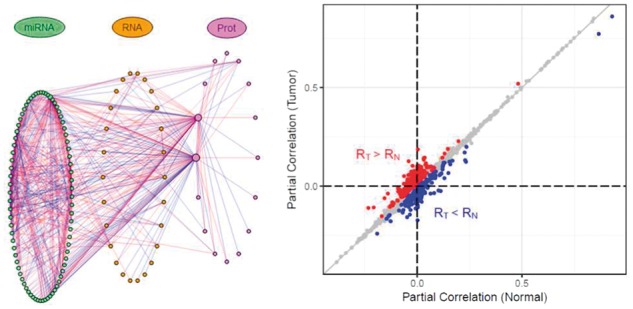
Fig. 1.

Left: iDINGO differential network plot (with microRNA nodes on the left, mRNA nodes in the center and protein nodes on the right), containing partial correlations increased in breast cancer (red edges) or normal tissue (blue edges), with FDR < 0.1. Right: A scatterplot comparing the partial correlations of the edges in the two groups, colored as in the network
