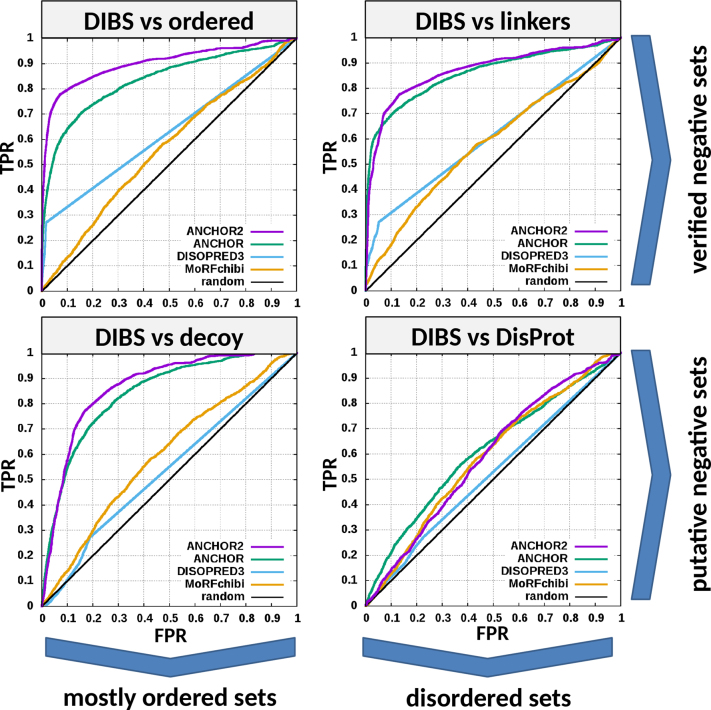
Figure 1.
ROC curves of four methods predicting disordered binding regions/MoRFs on the four different negative testing datasets. The upper row shows testing on verified negative data containing virtually no disordered binding regions. Negative sets of the bottom row might contain an unknown number of disordered binding regions, albeit with a significantly lower frequency compared to the positive set.

