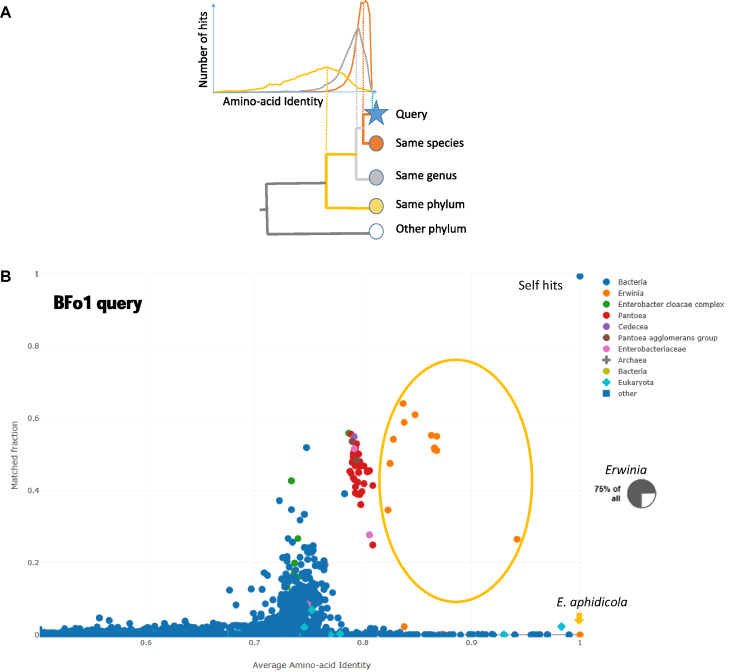
Figure 1.
(A) The principle of AAI-profiler, using colour to indicate database species related to the Query species at species level (orange), genus level (light gray), or phylum level (yellow). Top: Distributions of pairwise sequence identities between proteins of the Query proteome and their best match in a species in the database. Bottom: Cladogram showing nested taxonomic groupings. Different genes evolve at different rates, broadening the distributions of taxa which are more distantly related to the Query species. The vertical lines indicate that, for a given Query proteome, the proteome-wide average of the pairwise sequence identities (Average Amino-acid Identity, AAI) correlates with taxonomic distance. (B) AAI-profiler scatterplot for bacteria symbiont BFo1 of Frankinella occidentalis. Selected bacterial genera are highlighted by different colours. The dot nearest coordinates (1,1) is the query species. Species of the genus Erwinia occupy the range AAI > 0.9. The inset shows a pie chart from the taxonomic profile view: the majority of query proteins have a closest match in Erwinia species.

