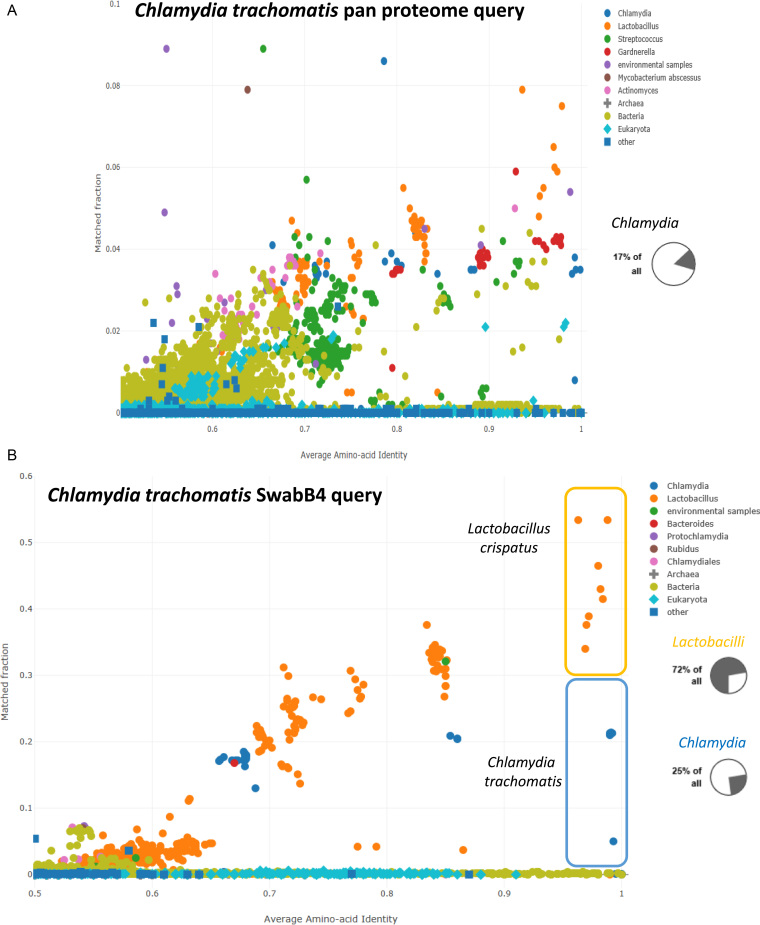
Figure 3.
The Chlamydia trachomatis pan proteome illustrates data contamination due to mislabeled multi-isolate samples. (A) The AAI-profiler scatterplot of the Chlamydia pan proteome shows a complex mixture of several species. The pie chart (inset from taxonomic profile view) shows that a minor fraction of query proteins in the Chlamydia trachomatis pan proteome have a nearest match in Chlamydia. (B) The AAI-profiler scatterplot of Chlamydia trachomatis strain SwabB4 shows a superposition of two species (Lactobacillus crispatus [orange dots] and Chlamydia trachomatis [blue dots]). The pie charts (inset from taxonomic profile view) show the proportion of the two genera in the sample.

