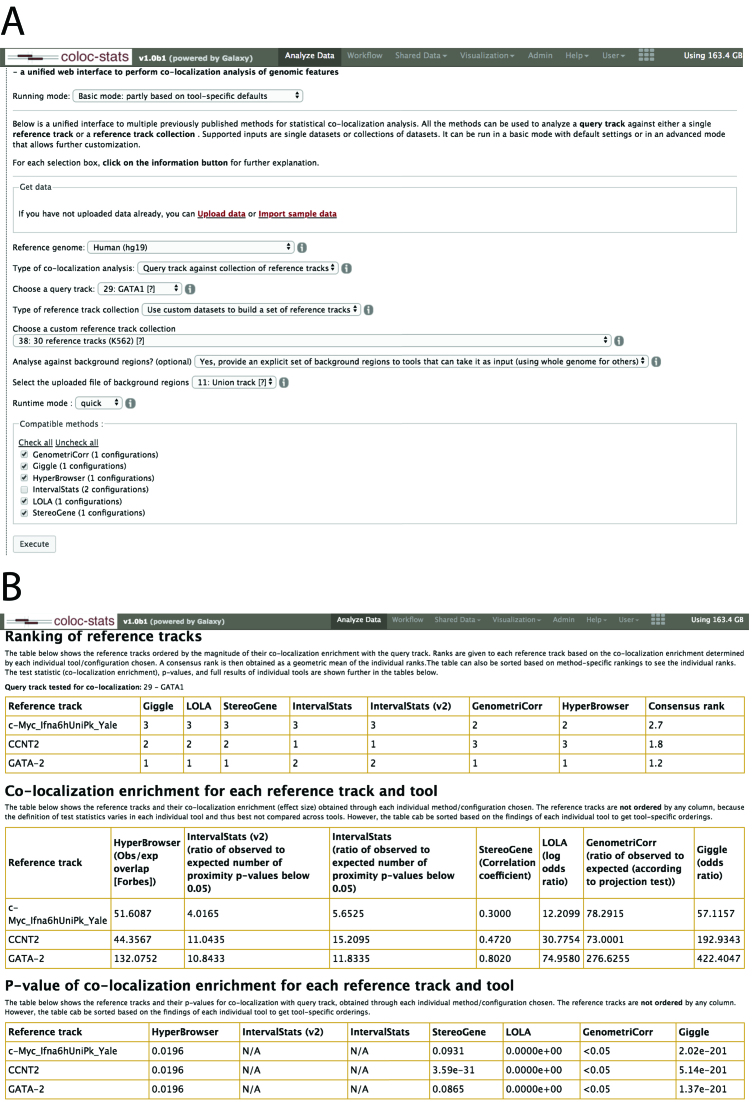
Figure 2.
(A)The figure shows the Coloc-stats GUI in basic mode. Through selection lists and check boxes, the user can parameterize the tools according to analytical requirements. Each combination of selections results in a corresponding list of compatible tools, where there can be one or more compatible parameter configurations per tool. The user can then select a subset of tools to execute the analysis. (B)The figure shows a screenshot of the results page of a typical Coloc-stats analysis of one query track versus a collection of reference tracks. The results page is organized in four sections: (i) Ranking, where the reference tracks are ranked by the descriptive statistic according to each tool and parameter configuration, as well as a consensus column showing the averaged rank across methods; (ii) Descriptive statistics, one per reference track for each tool and parameter configuration is displayed; (iii) P-values, corresponding to each of the descriptive statistics (if the tool provides one) to assess the significance of each paired track analysis; (iv) Detailed results, list of links to the detailed results output of all tools for each reference track in the collection.

