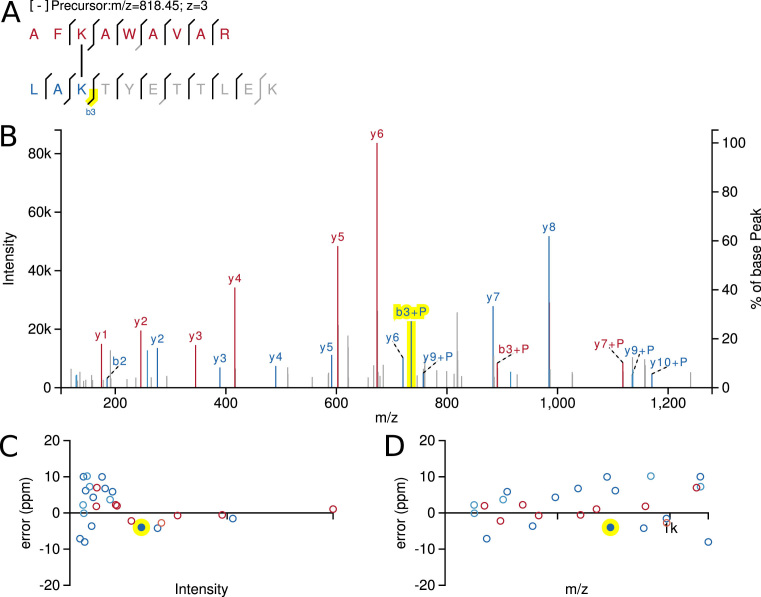
Figure 2.
SVG output of xiSPEC’s views for a cross-linked peptide example. (A) Peptide sequence with fragmentation key. Amino acid residues in one-letter code. Lines show matched peptide fragments. Grayed-out residues are not included in currently selected fragment. (B) Annotated mass spectrum. Matched peaks are colored and labeled (though labels of neutral-loss fragments are hidden in this example). (C) and (D) show spectra QC plots. Each point represents a matched peak of the mass spectrum. (C) Fragment match error over peak intensity. (D) Match error over m/z. Coloring (red and blue) is used to differentiate between the two peptides. Neutral-loss fragments are displayed in a lighter color. Yellow highlight is the currently selected fragment (interconnected between all views).

