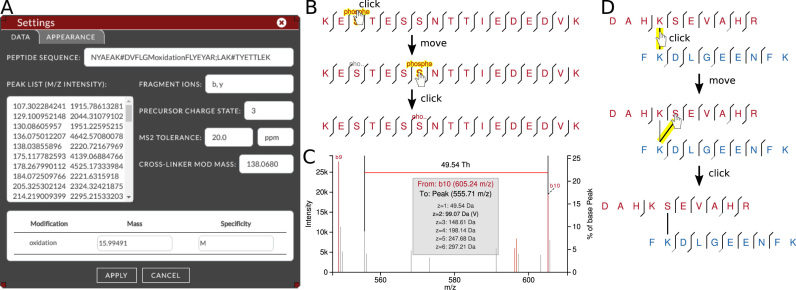
Figure 3.
xiSPEC feature examples. (A) Settings view. Peptide input data can be modified in the displayed tab. Appearance customization can be done through the ‘appearance’ tab. (B) Changing PSM modification positions. (C) Use of measuring tool in zoomed-in excerpt of spectrum. Measure distance between peaks with automatic calculation and amino-acid residue matching for multiple charge states. (D) Changing cross-linker position.

