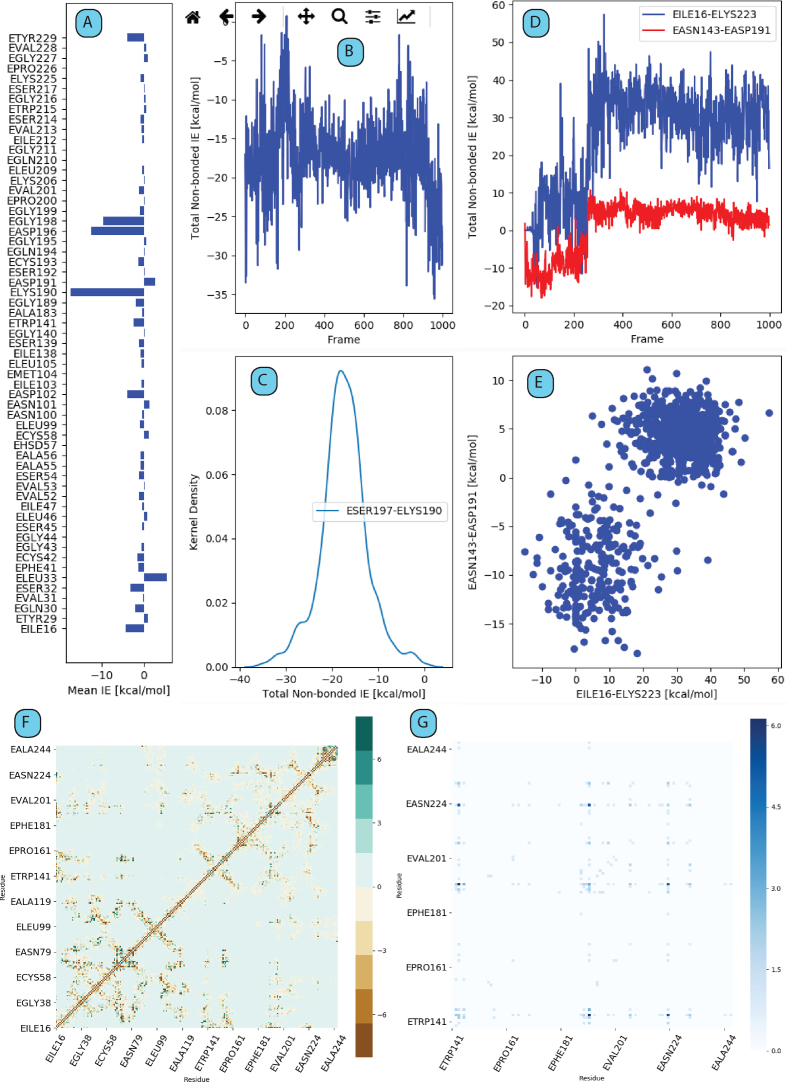
Figure 2.
An overview of output plots as generated by gRINN View Results UI. (A and B) Example single interaction energy time series and distributions, respectively. (C) Average non-zero interaction energies between a selected residue and all other residue in protein structure. (D) Time series of interaction energies between residues taking part in a selected interaction energy correlation pair. (E) Corresponding correlation plot of the plot in D. (F) Interaction Energy Matrix (IEM). (G) Residue Correlation (RC) matrix.

