
Figure 1.
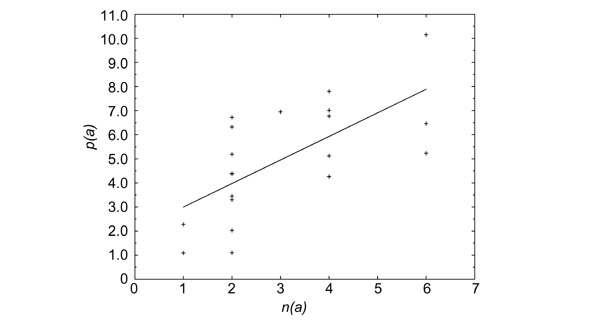
The relative frequency p(a) (in %) of amino acid a (right-hand column of Table 1), as a function of the number of synonyms n(a) that code for it. The linear regression line is indicated; the correlation coefficient is equal to 0.66.
Official websites use .gov
A
.gov website belongs to an official
government organization in the United States.
Secure .gov websites use HTTPS
A lock (
) or https:// means you've safely
connected to the .gov website. Share sensitive
information only on official, secure websites.
The relative frequency p(a) (in %) of amino acid a (right-hand column of Table 1), as a function of the number of synonyms n(a) that code for it. The linear regression line is indicated; the correlation coefficient is equal to 0.66.