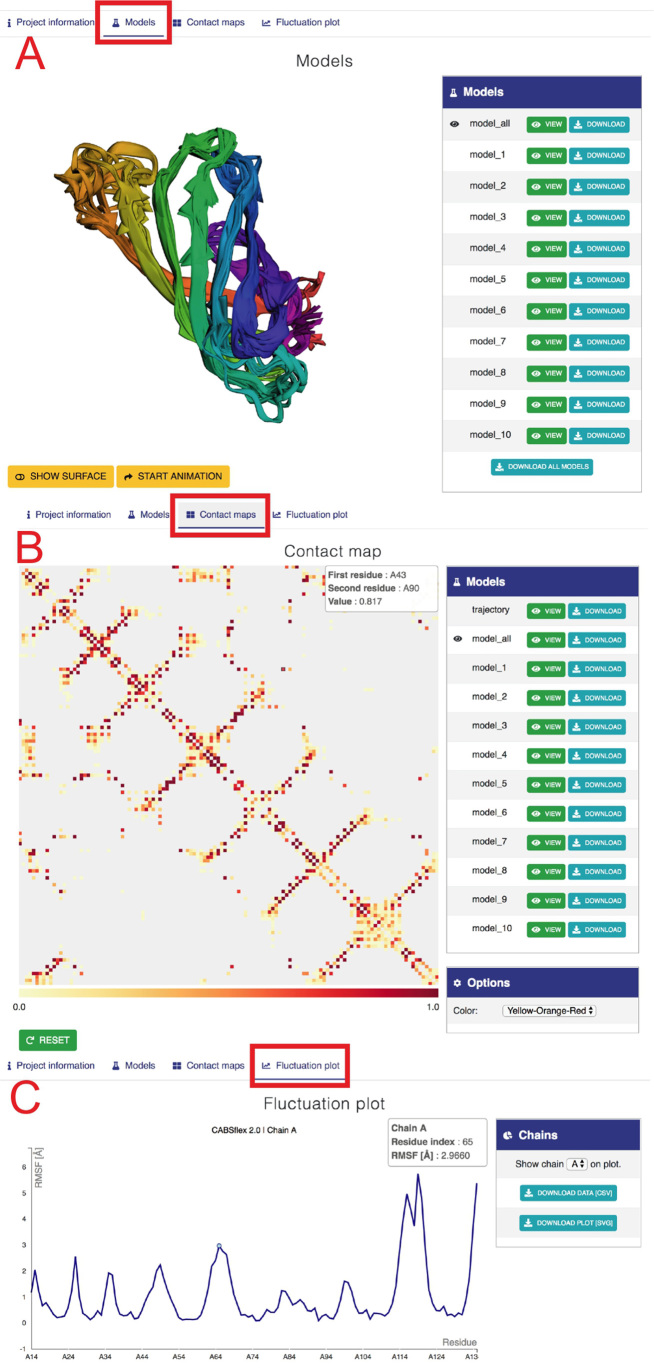
Figure 3.
Example view of output tabs for streptavidin protein (with default CABS-flex settings, 2RTM PDB was used as the input). (A) ‘Models’ tab. The left panel shows three-dimensional visualization of 10 models. The right panel provides buttons to display and download the selected model or all 10 models (model_all). Below: buttons to modify the surface and rotate the model. (B) ‘Contact maps’ tab. The tab shows a matrix with contacts with the color scale below (note that pointing the cursor at the contact between residue 39 and 104 in chain A invoked an information balloon with contact information). Right panels provide buttons to display and download maps (in a graphic svg format and text files, both as zip files under Download buttons), and the ‘Options’ section that allows changing the color range of contacts. (C) The ‘Fluctuation plot’ tab shows the residue fluctuation profile (RMSF) for a selected protein chain. Right panels allow selecting a protein chain and downloading the displayed data.

