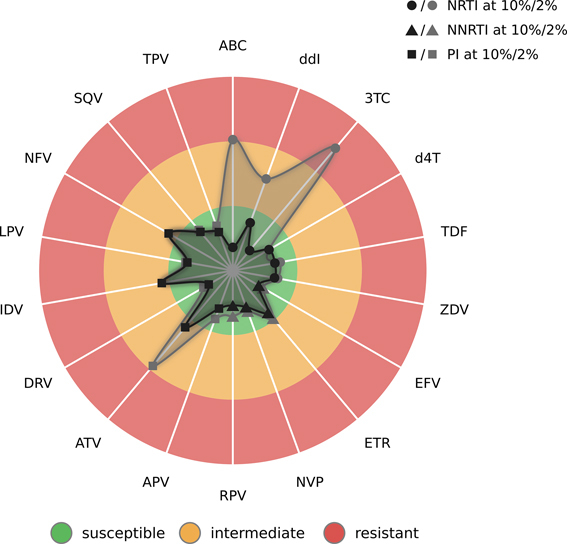
Figure 2.

Radar plot of predicted drug resistance for the HIV-1 sample from the first case study. Each spoke in the plot relates to an antiretroviral drug. Each drug class is represented by a different type of symbol. Here, circles, triangles, and squares indicate the results for nucleoside reverse transcriptase inhibitors (NRTIs), non-nucleoside reverse transcriptase inhibitors (NNRTIs), and protease inhibitors (PIs), respectively. The three colored circle sectors indicate the estimated levels of drug resistance, from inside to outside: green for susceptibility, orange for intermediate resistance, and red for resistance. Resistance levels are indicated by two surfaces. The inner surface shows the estimated level of resistance for the consensus sequence based on the reference prevalence cutoff at 10%, while the outer surface indicates the level of resistance for the consensus sequence based on the personal cutoff at 2%. The points defining the surfaces are determined through the z-scores that are predicted by geno2pheno[resistance]. Points lying further to the inside of the plot indicate decreased drug resistance, while points lying further to the outside indicate increased resistance.
