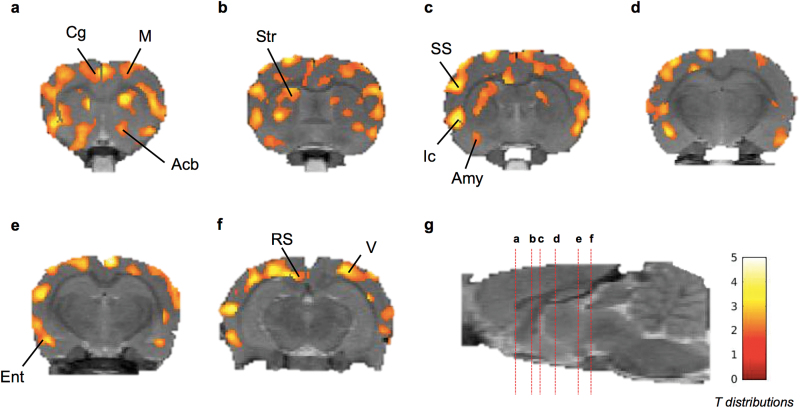
Figure 1.
Coronal brain section showing statistical parametric map for increase in relative 18F-2-fluoro-2-deoxy-D-glucose (18F-FDG) uptake after Modafinil(MOD) +flecainide (THN102) treatment in comparison to MOD alone in rats. Following a cranio-caudal orientation centered on bregma (anterior is positive), coronal brain sections were at (a) 1.05, (b) -0.68, (c) -1.29, (d) -3.07, (e) -4.34, and (f) -5.76 millimeters from the bregma and (g) sagittal view of the brain with the marked coronal sections (red dotted lines) from a to f. Color scale represents all T distributions achieving statistical significance (see SPM statistical analysis). Acb, accumbens; Amy, amygdala; Cg, cingulate cortex; Ent, entorhinal cortex; Ic, insular cortex; M, motor cortex; RS, retrosplenial cortex; SS, somatosensory cortex; Str, striatum; V, visual cortex.

