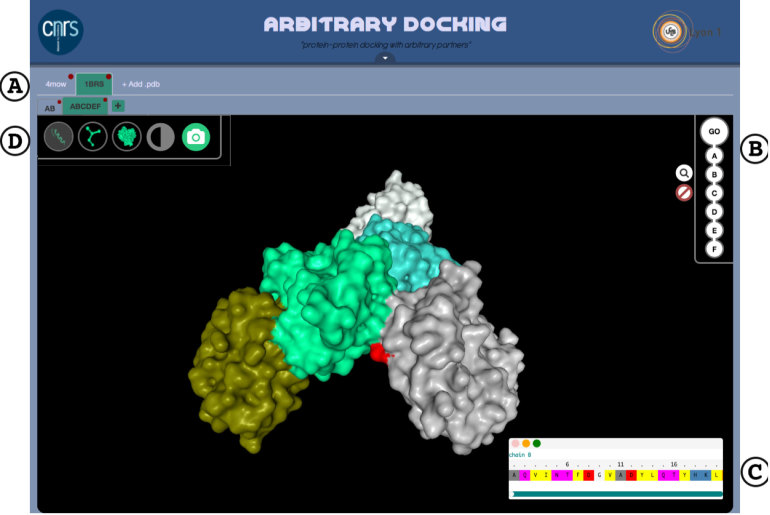
Figure 1.
(A) The ArDock user interface allows the manipulation of different proteins and set of protein chains, each opened in distinct tab. (B) Protein chains can be selected or deleted before being analyzed by the server. (C) The amino acid sequence of each chain can be visualized, and individual amino acids highlighted in the structure representation (here an aspartic acid colored in red). (D) Ribbon, ball-and-stick and surface representations are available. The two icons on the right-end side allow to modify the background color and to take a snapshot of the structure.

