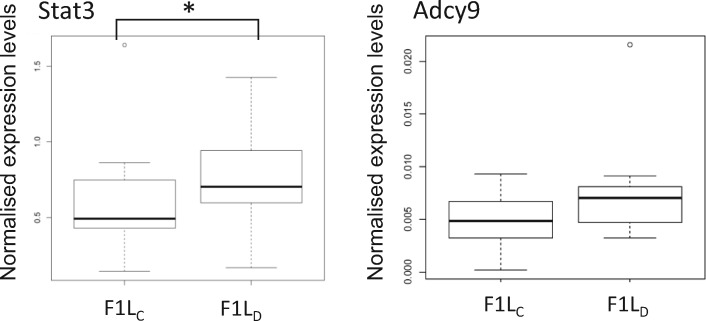
Figure 5:
Box plot of total gene expression changes in Stat3 (left) and Adcy9 (right). Expression of Stat3 but not of Adcy9 was significantly changed in F1 sons after LPD of their fathers [P = 0.058, signed Wilcoxon rank test (unpaired)]. Stat3 was 1.2-fold up-regulated after the diet. C, control [F1LC]; N, sons after LPD of fathers [F1LD]. Vertical lines in boxes depict median. Dots, outliers

