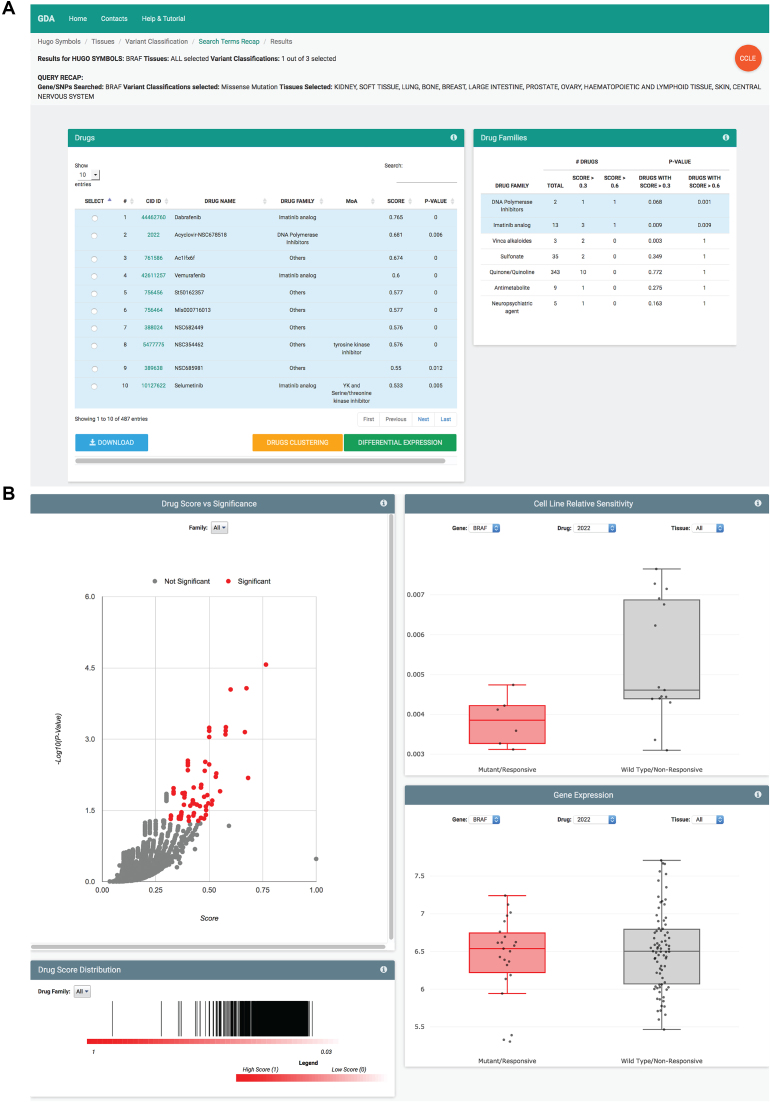
Figure 2.
Result pages of the from gene to drug and from signature to drug modules. (A) The result pages of the from gene to drug and from signature to drug analyses list of all drugs that are active on cell lines bearing the selected genomic background. In the table, drugs are identified in terms of compound ID (linking to the PubChem), name, drug family, mechanism of action (MoA), score and statistical significance. (B) Results can be visualized in terms of (from top left to bottom right): score and P-value of statistically significant compounds; distribution of compound scores grouped by drug family; distribution of relative sensitivity in mutant/responsive and wild-type/non-responsive cell lines; gene expression level of the selected gene in mutant/responsive and wild-type/non-responsive cell lines.

