
Fig. 4.
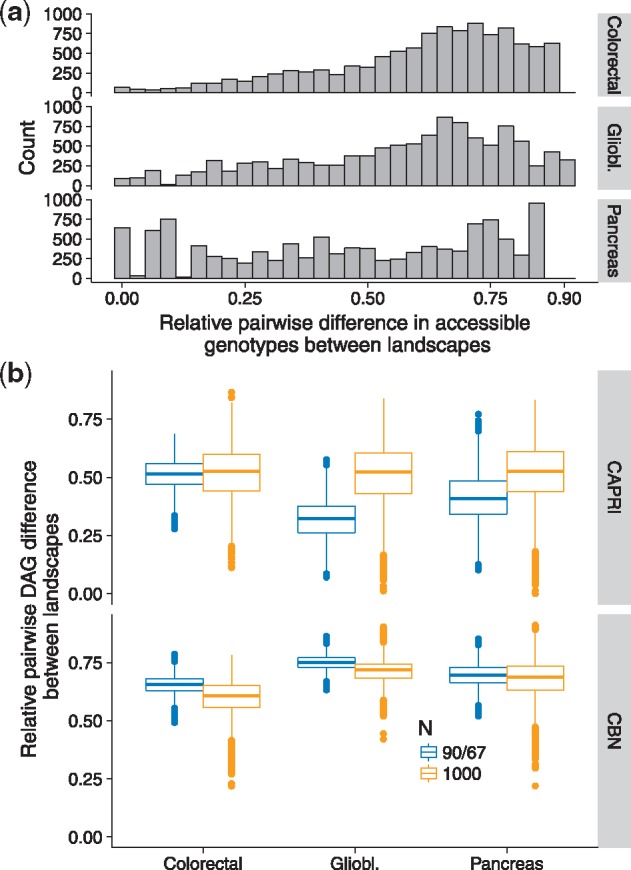
Fitness landscapes characteristics and DAG differences in three cancer datasets. (a) Histograms of relative pairwise differences in accessible genotypes over all possible 150 × 149/2 pairs of landscapes for each dataset. (b) Box-plots of relative pairwise differences between all pairs of DAGs inferred from different landscapes (each box-plot plot is based on 150 × 149/2 points; each point itself is the average of 400 (20 × 20) comparisons)