Figure 1.
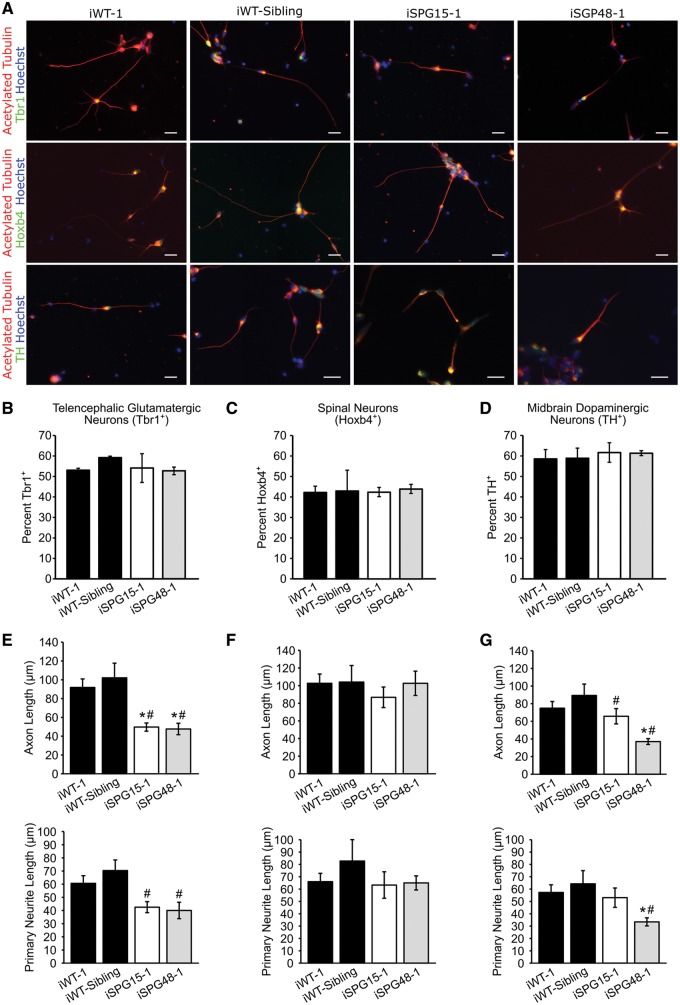
SPG15 and SPG48 neurons display impaired neurite outgrowth. (A) Immunofluorescence images of week 6 telencephalic, spinal and mDA neurons. Cells were stained for acetylated tubulin to label neurites, along with the telencephalic glutamatergic marker Tbr1, spinal neuron marker Hoxb4, or the dopaminergic marker TH. (B) Quantification of the percentage of Tbr1+ neurons. (C) Quantification of Hoxb4+ spinal neurons. (D) Quantification of TH+ dopaminergic neurons. (E) Quantification of week 6 neurite outgrowth parameters, including average axon length (longest neurite) and average length of all primary neurites in Tbr1+ neurons 48 h after plating. (F) Hoxb4+ neurite outgrowth quantification. (G) TH+ neurite outgrowth quantification. Data are presented as means ± SEM, N = 3–4 coverslips with a minimum of 50 cells analyzed per group. *P < 0.05 compared with iWT-1; #P < 0.05 compared with iWT-sibling cells. Scale bars: 20 µm.

