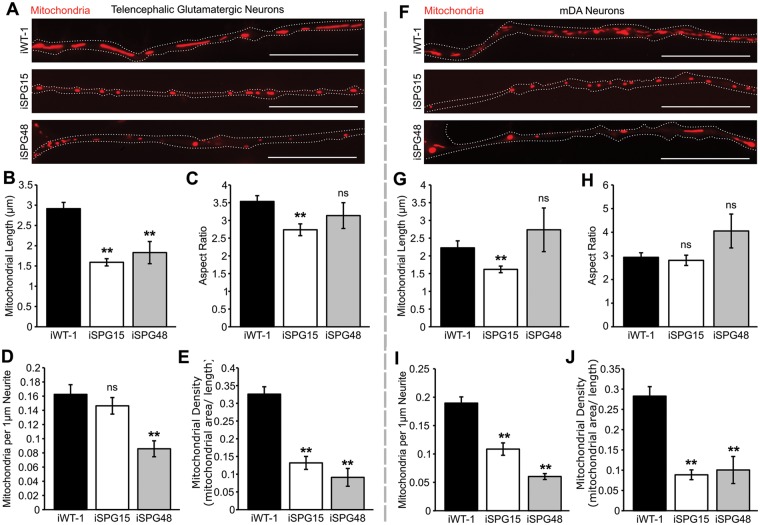
Figure 3.
SPG15 and SPG48 neurons have altered mitochondrial morphology. (A) Immunofluorescence images of mitochondria within neurites taken in live, week 10 telencephalic glutamatergic neurons derived from iWT-1, iSPG15–1 and iSPG48–1 iPSCs, stained with MitoTracker CMXRos (red). (B) Average mitochondrial length, calculated by measuring the longest axis of each mitochondrion. (C) Average aspect ratio, calculated by dividing the major axis by the minor axis for each mitochondrion. (D) Average number of mitochondria per 1 µm neurite. (E) Average linear mitochondrial density, calculated by dividing the total mitochondrial area by the neurite length. (F) Mitochondrial staining in week 10 mDA neuron cultures derived from iWT-1, iSPG15-1 and iSPG48–1 iPSCs. (G) Mitochondrial length, (H) mitochondrial aspect ratio, (I) mitochondria per 1 µm neurite, and (J) linear mitochondrial density. Data are presented as means ± SEM from a minimal of 20 axon segments in three independent experiments. **P < 0.01 versus iWT-1; ns, not significant. Scale bars: 20 µm.

