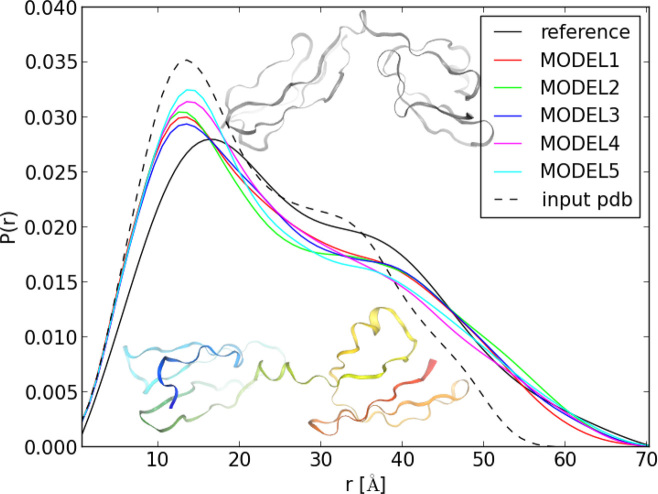
Figure 3.
Comparison of the distance distribution from SAXS measurements of the central portion of Factor H, modules 10–15 with those calculated from the experimental 2KMS structure and from the five UNRES server models. The 2KMS experimental structure (top, gray) and UNRES model 1 [bottom, rainbow-colored from the the N- (blue) to the C-terminus (red)] are superposed on the graph.

