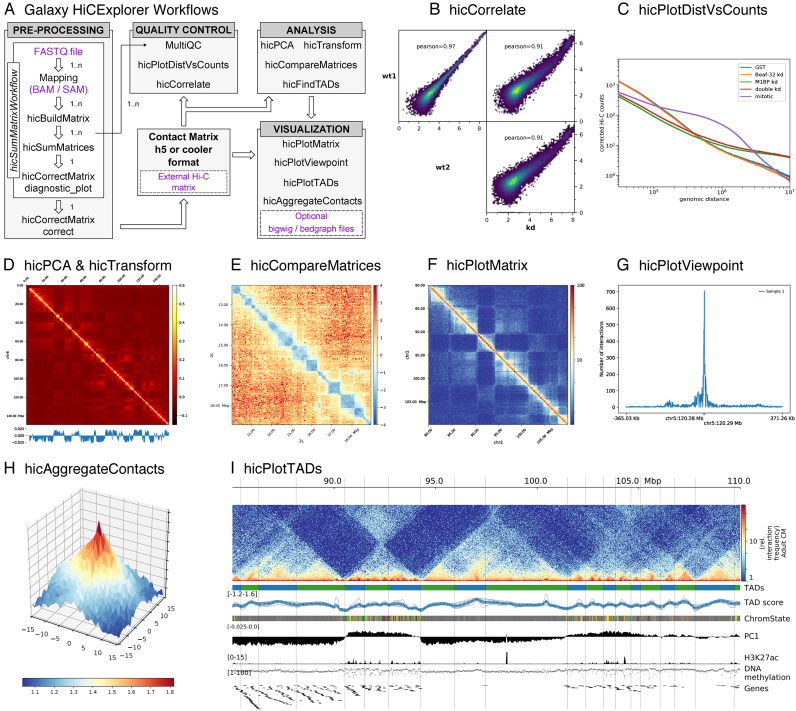
Figure 1.
(A) Galaxy HiCExplorer workflows and tools. Entry points for external data are highlighted in purple. Quality control tools: (B) Output of hicCorrelate comparing two wild types and one knockdown samples. (C) Output of hicPlotDistVsCounts that shows changes of the number of contacts for different conditions. Analysis tools: (D) hicPlotMatrix of the Pearson correlation matrix derived from a contact matrix for chromosome 6 in mouse computed with hicTransform. The optional data track at the bottom shows the first eigenvector for A/B compartment obtained using hicPCA. (E) The pixel difference between a Hi-C corrected matrix for wild type condition and a knock down was computed using hicCompareMatrices and a 7Mb region is visualized using hicPlotMatrix. Visualization tools: (F) Contact matrix plot of a 80 to 105 Mb region of chromosome 2 in log scale. (G) Example output of hicPlotViewpoint showing the corrected number of Hi-C contacts for a single bin in chromosome 5 (output similar to 4C-seq) (11). (H) A Hi-C matrix was converted into an observed vs. expected matrix using hicTransform and this matrix, together with the location of high-affinity sites from (12) were used to run hicAggregateContacts. (I) 85 Mb to 110 Mb region from human chromosome 2 visualized using hicPlotTADs. TADs were computed by hicFindTADs. The additional tracks added correspond to: TAD- separation score (as reported by hicFindTADs), chromatin state, principal component 1 (A/B compartment) computed using hicPCA, ChIP-seq coverage for the H3K27ac mark, DNA methylation, and a gene track. Hi-C data for B, C, E and H from Drosophila melanogaster S2 cells from (8). Hi-C data for D, F and I from mouse cardiac myocytes (13). Additional tracks in I from (13).

