Figure 5.

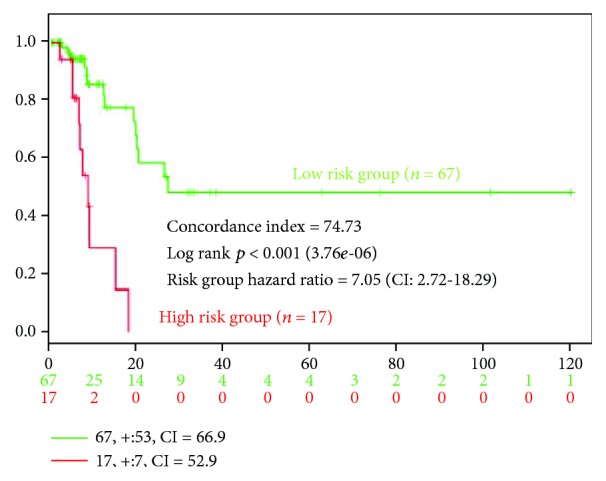
Kaplan-Meier survival curves stratified by three different subgroups. The survival expressions in patients with low risk (green) and high risk (red) are indicated.

Kaplan-Meier survival curves stratified by three different subgroups. The survival expressions in patients with low risk (green) and high risk (red) are indicated.