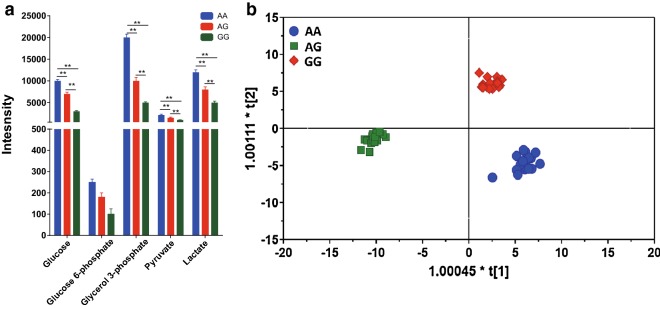
Fig. 2.
The role of rs61991156 in regulatory glycolysis and other related metabolomics in GC patients. a Comparison of glycolysis-related metabolites in different genotypes. b OPLS-DA scores plot showed a distinct plasma metabolic profile between among AA, AG and GG (R2X = 0.561, R2Y = 0.978, Q2(cum) = 0.939). Data were presented as the mean ± SEM. *Indicated P < 0.05 and **indicated P < 0.01

