Fig. 1.
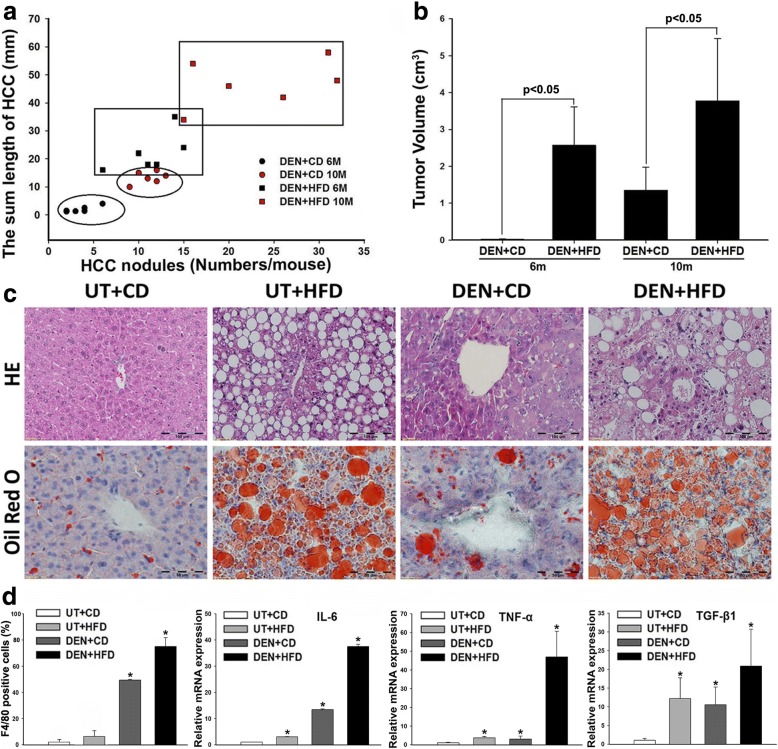
a The HCC tumor growth pattern represented as the regression of HCC nodule length and HCC nodule numbers in individual HCC mouse. b Tumor volume from 4 groups at month 6 and month 10. c Representative histological changes from all 4 experimental groups at month 10. Histological changes of NASH-HCC in DEN+HFD mice were identified in tissue sections by H&E staining. Lipid drops were identified in tissue sections by Oil red O staining. NASH was found typically affecting the liver parenchyma with macrovesicular changes presented in a predominantly perivenular distribution. In addition to fatty change, many hepatocytes in acinar showed ballooning and contain Mallory’s hyaline, and mixed infiltrate of inflammatory cells. UT: untreated; CD: control diet; HFD: high fat diet; DEN: N-nitrosodiethylamine. d Positive F4/80 cells and mRNA expressions (IL-6, TNF-α and TGF-β1) in the liver tissues from 4 groups at month 6 and month 10. *, P < 0.05 vs UT + CD

