
Fig. 3.
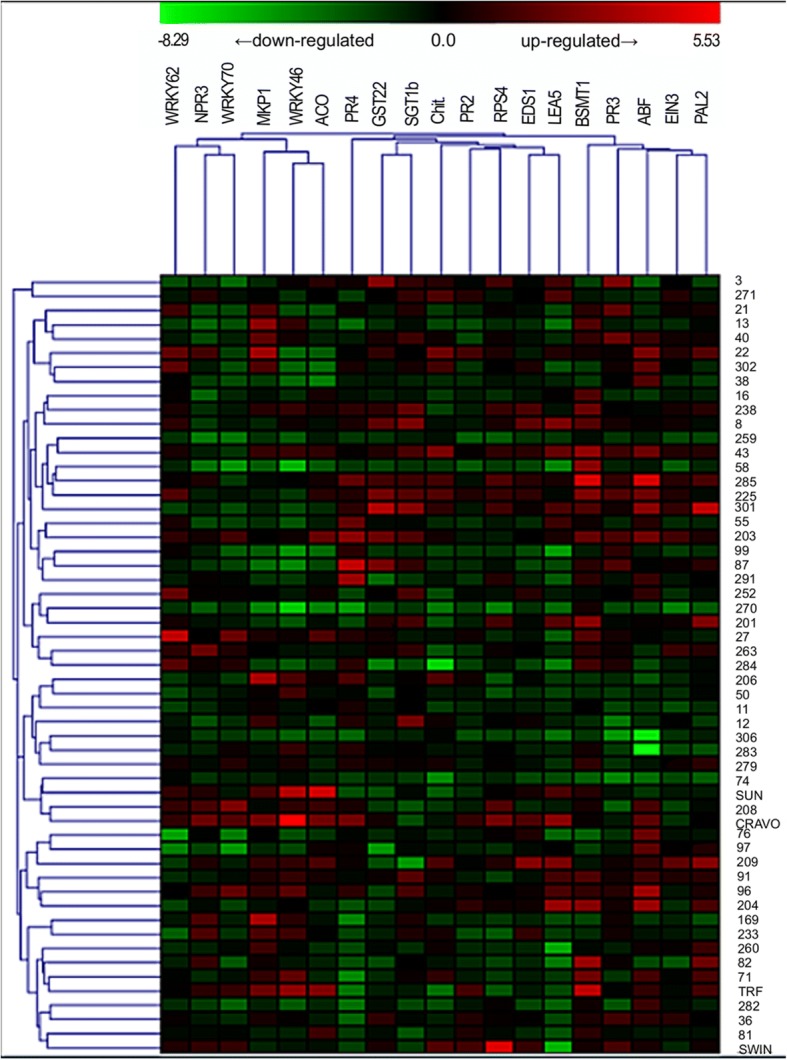
Heatmap of the gene expression profile by clustering analyses between 19 evaluated target genes with 55 selected genotypes (51 hybrids, Rubidoux trifoliate [TRF], Sunki mandarin [SUN], Rangpur lime [CRAVO] and Swingle citrumelo [SWIN]). The heatmap was made using Log2Fold change normalized data as input to the MeV (MultiExperiment Viewer) program v. 4.9 (http://sourceforge.net/projects/mev-tm4/). Names of genes and gene hierarchical cluster are shown in the top of the figure. Log2Fold change expression values representation ranges from red (highest expression) to green (lowest expression). Sample names (55 selected genotypes) are shown on the right side of the figure, while sample hierarchical cluster is shown on the left side