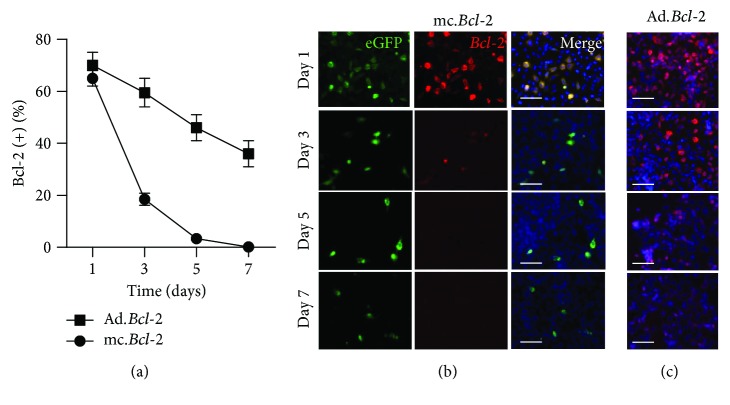
Figure 1.
Time course of transient Bcl-2 expression in NSCs. (a) Flow cytometric quantification of Bcl-2 positive cells over 1 week posttransfection with minicircle constructs (circle) or posttransduction with adenovirus (square). (b-c) Representative immunofluorescent images demonstrating a decline in eGFP and Bcl-2 expression in both minicircle-transfected (b) and adenovirally transduced NSCs (c) over 1 week. Scale bars in both (b) and (c) = 50 μm.

