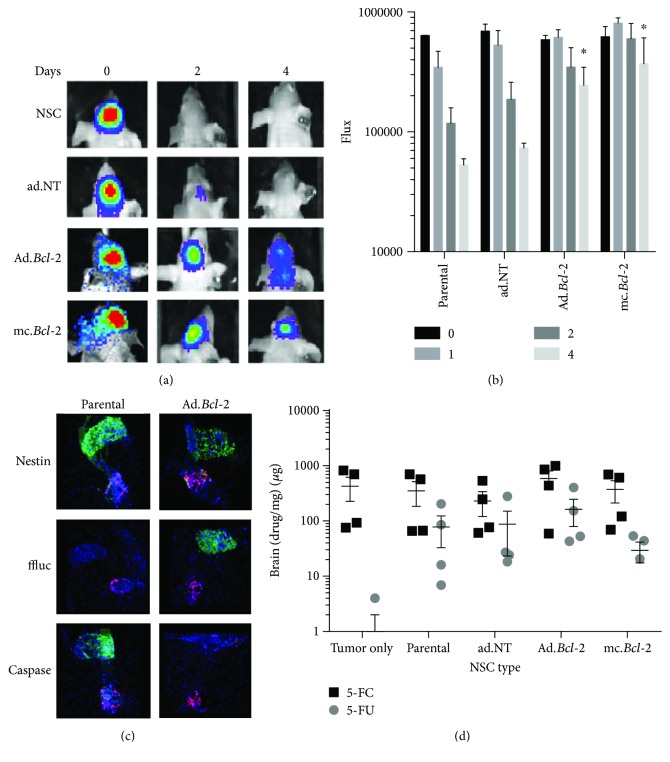
Figure 3.
Bioactive effects of Bcl-2 expression in NSCs in vivo. (a–c) NSC survival after ipsilateral transplantation into glioma-inoculated mice. (a) Representative xenogen images of ffluc-expressing NSCs at select time points. (b) Quantification of xenogen flux in all animals (mean + SEM) shown at select time points. Asterisks indicate statistically significant increases in NSC flux relative to time-matched parental NSCs (p < 0.05). (c) Representative tissue sections showing DsRed.U251 tumor (red) and NSC (green) injection sites 1 day after NSC injections. NSCs are stained for nestin (present in live and dead NSCs), eGFP (expressed only in live NSCs), and active caspase-3 (expressed only in dying NSCs). (d) LC/MS/MS quantification of 5-FC prodrug (black) and 5-FU (gray) active drug present in mice brains implanted with both parental and genetically modified NSCs.

