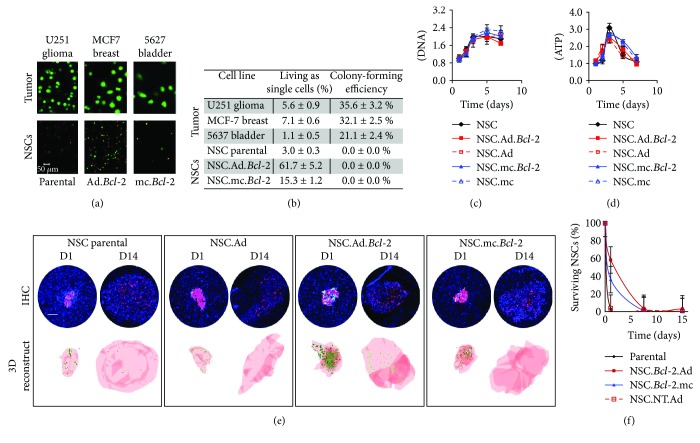
Figure 5.
Tumorigenicity of Bcl-2 modified HB1.F3.CD NSCs. (a-b) Bcl-2-expressing NSCs showed no tendency to form tumorigenic colonies characteristic of cancer cells when cultured for 7 days in agar. (a) Representative 20x confocal microscopy z-stacks obtained on day 7 after calcein-AM labeling. Tumor colonies are visible in the top panel (ordered right to left: U251 glioma, MCF7 breast cancer, and 5637 bladder cancer) and NSCs are visible in the bottom panel (ordered right to left: parental, Ad.Bcl-2, and mc.Bcl-2). Scale bar in lower left image = 50 μm which applies to all images in Figure 5(a). (b) Table displaying quantitative data obtained using ImageJ analysis software to count and size colonies in 5 images per condition. Values are normalized with respect to initial day 0 seeding counts. Colonies were defined as clusters with diameters > 20 μm. (c-d) Total DNA (c) and ATP (d) levels measured as NSCs proliferated in monolayer culture over the course of 1 week. (e-f) Decline of eGFP positive NSCs over the course of two weeks after implantation into tumor- and nontumor-bearing brains. (e) Representative brain sections and 3D renderings of tumors reconstructed from serially sectioned brains highlighting the distribution of eGFP-expressing NSCs within a DsRed-expressing glioma. Scale bar = 100 μm. (f) Quantified estimate of the percent of injected eGFP-expressing NSCs present within tumors over the course of 2 weeks.

