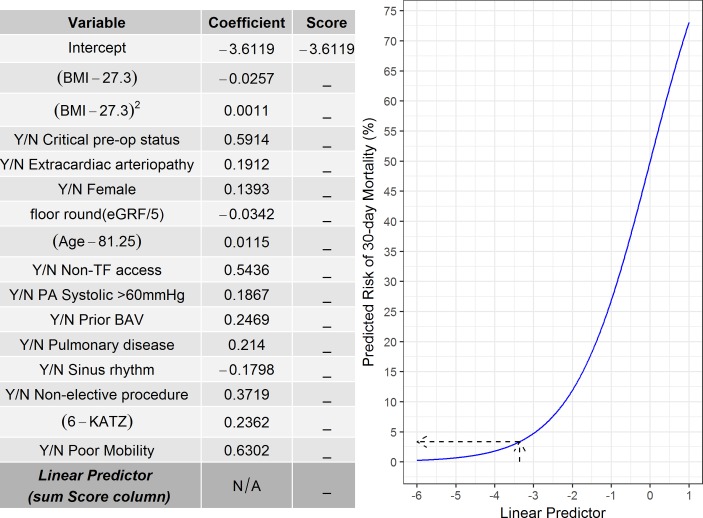
Figure 3.
Graphical representation of the UK-TAVI (transcatheter aortic valve implantation) clinical prediction model (CPM). First, multiply each variable (either yes/no for categorical variables or enter the observed continuous variable) by the corresponding coefficient and then sum across all variables to obtain the linear predictor. The linear predictor can then be converted to a predicted risk using the graph or through the equation: exp(Linear Predictor)/{1+exp(Linear Predictor)}. The dotted arrows show the example described in the text. BAV, balloon aortic valvuloplasty; BMI, body mass index; eGFR, estimated glomerular filtration rate; N/A, not applicable; PA, pulmonary artery; TF, transfemoral access.

