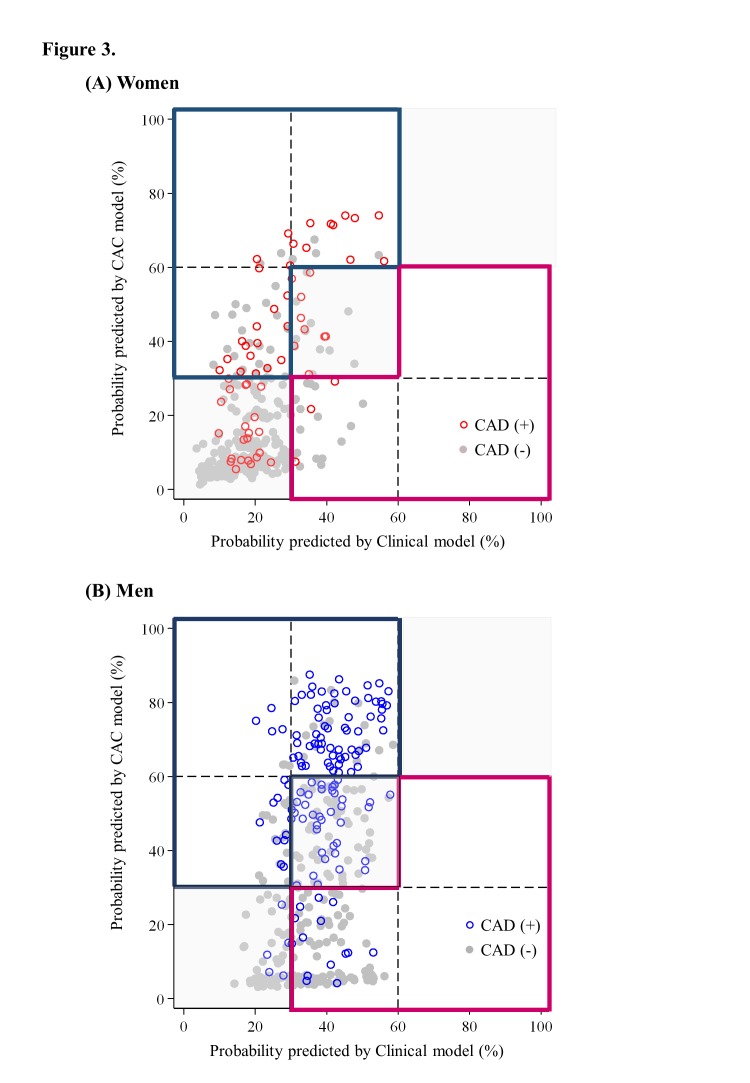
Figure 3.
Probability of obstructive CAD predicted by CAC model against the risk predicted by clinical model: (A) women and (B) men. Grey area=both models did not change the risk categories; blue area=reclassified higher categories by CAC model; pink area=reclassified lower categories by CAC model; hollow circle=CAD; and solid circle=non-obstructive CAD. The graph shows the probability for CAD in women and men predicted by the clinical model (horizontal axis) against the risk predicted by CAC model (vertical axis). Lines at predicted probabilities of 30% and 60% are superimposed to show reclassification over clinically relevant cut points. CAD, coronary artery disease; CAC, coronary artery calcification.

