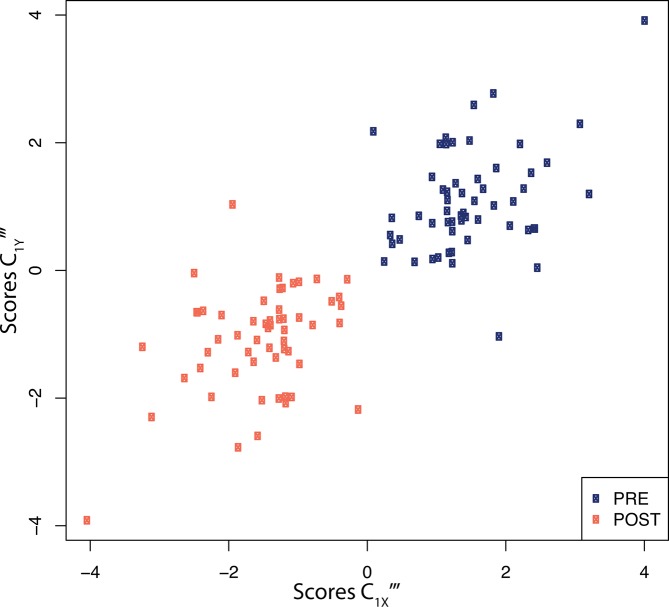
Figure 3.
X-Y score plot representing the PLS scores for the first exposure PLS component (C1X‴x-axis) as a function of the scores of the first PLS component for proteins (C1Y‴, y-axis). Scores are presented for all (n=60) participants before (blue), and after (orange) the swimming session. Results are presented for the sparse PLS models performing variable selection of both exposures and proteins. PLS, partial least squares.

