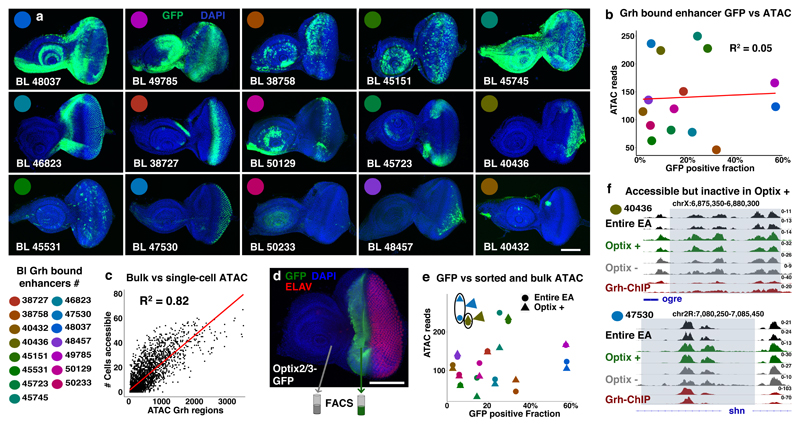
Figure 4. Accessibility of Grainyhead enhancers does not imply activity.
(a) Confocal images showing the activity (GFP, green) of 15 Grh bound Janelia-Gal4 enhancers14 in the eye-antennal discs (reproducible GFP pattern in at least 4 discs per shown image, scale bar = 100μm). (b) Plot visualizing the relative activity (GFP% of encompassing eye-antennal disc) and accessibility (ATAC-seq averaged over 30 independent eye-antennal disc samples) of the 15 Grh bound enhancers. (c) Correlation plot showing the accessibility of the 3246 Grainyhead regions (normalized ATAC-reads) on the x-axis versus the actual number of single cells where the region is accessible (Spearman’s ρ = 0.82). (d) Confocal image showing the reproducible (5 discs, scale bar = 100μm) expression pattern of the Optix2/3 enhancer48 (GFP, green; cell nuclei DAPI, blue; and differentiated photoreceptors (ELAV, red)) in the eye-antennal disc. (e) Plot visualizing the relative activity (GFP%) and accessibility (ATAC-seq, circle: entire eye-antennal discs, triangle: Optix positive subpopulation) of the 15 Grh bound enhancers. (f) Accessible chromatin and Grh-ChIP profiles of two Grh bound enhancers, 40436 and 47530, both are accessible in the Optix positive subpopulation, but show no activity there (2 biological replicates for each sample).

