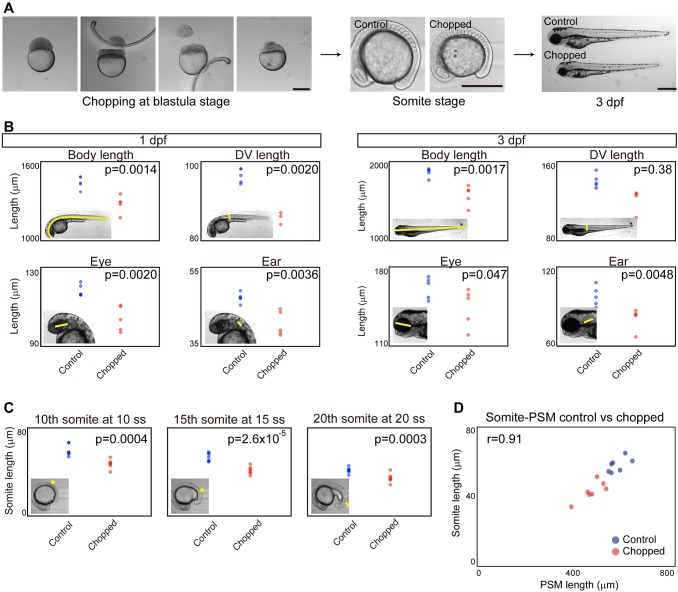
Fig. 2.
Somite scaling between individuals of different sizes. (A) Size reduction technique. Scale bars: 500 μm. dpf, days post-fertilization. (B) Comparison of body and organ sizes between control and chopped embryos. Insets illustrate the region measured. n=5 each. (C) Comparison of somite size between control and chopped embryos. Somite of interest indicated by arrowhead in insets. n=5 each. (D) Somite size versus PSM size in control and chopped embryos. n=7 each.

