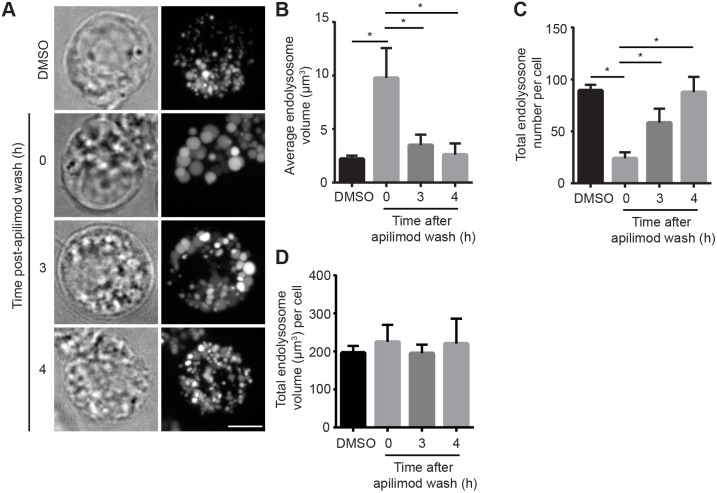
Fig. 6.
Volumetric analysis of endo/lysosome number and volume during PIKfyve reactivation. (A) Cells were pre-labelled with Lucifer Yellow as before and then exposed to vehicle only or to 20 nM apilimod for 1 h, followed by removal and chase in fresh medium for the indicated times. Fluorescence micrographs are z-projections of 45-55 z-planes acquired by spinning disc confocal microscopy. Scale bar: 5 µm. (B-D) Volumetric quantification of individual endo/lysosome volume (B), endo/lysosome number per cell (C) and total endo/lysosome volume per cells (D). Data shown are the mean±s.e.m. from three independent experiments, with at least 15-20 cells per condition per experiment. *P<0.05 between data indicated by lines using one-way ANOVA and Tukey's post hoc test.

