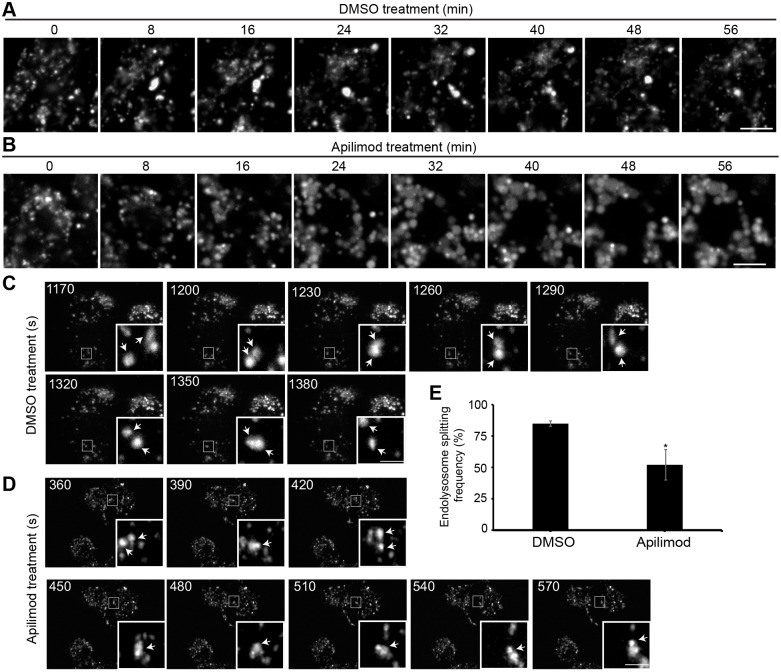
Fig. 8.
Live-cell imaging of apilimod-induced lysosome swelling. (A,B) Cells were pre-labelled with Alexa Fluor 546-conjugated dextran, followed by (A) vehicle alone or (B) 20 nM apilimod at time 0 min. Single-plane images were obtained by spinning disc microscopy at 1 frame/2 min. Time in min refers to time after adding vehicle or apilimod. See Movies 3 and 4 for full capture. Scale bars: 5 µm. (C,D) Swep-tfield imaging of RAW cells exposed to (C) vehicle or (D) 20 nM apilimod. See Movies 5 and 6 for full capture. Shown are z-collapsed frames at 30 s intervals. The inset is a magnified portion of the field-of-view tracking a few endo/lysosomes (arrows) undergoing contact and split events, which may represent fusion or fission. Scale bars: 3 µm. (E) Rate of ‘splitting’ events over 30 min in vehicle- or apilimod-treated cells showing a reduction in splitting in PIKfyve-inhibited cells, which may reflect reduced fission. *P<0.05 by Student's t-test.

