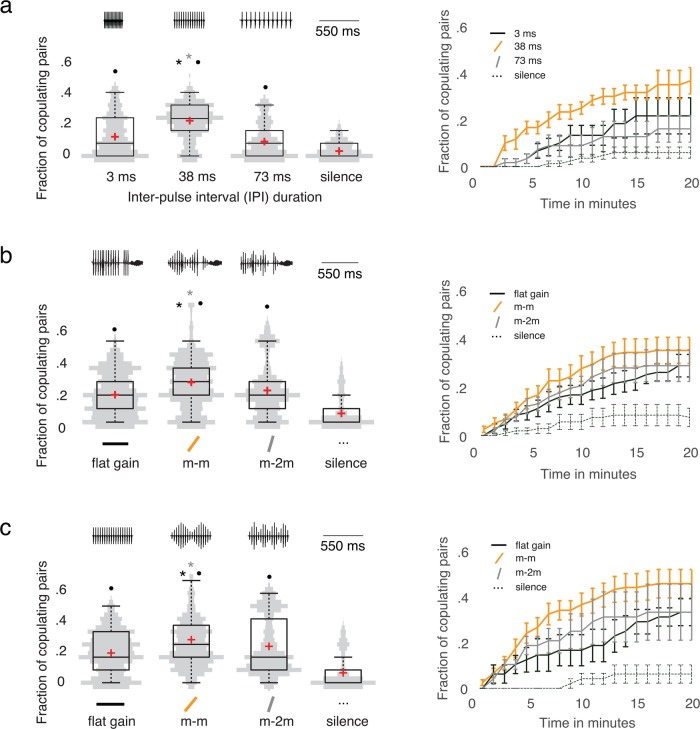
Fig. 2.
Amplitude envelope preference of female D. melanogaster. We present our data in two different forms: (left) violin distribution plots and (right) survivorship curves. (A) D. melanogaster CS females prefer their own strain's IPI duration (IPI = 38 ms) over shorter IPIs (3 ms), longer IPIs (73 ms), and the silence control condition. We calculated a P-value of P<0.0001 and an F statistic of F ≈ 34.51 in a one-way ANOVA test. There are nc=264 mixed-sex couples. To measure IPIs, we detected pulses in modulated playbacks automatically with FlySongSegmenter (Arthur et al., 2013) and then computed the distance between detected pulses. (B) D. melanogaster CS females preferred their own strain's song-amplitude-structure envelope (m-m) over flat gain, steeper gain (twice the D. melanogaster mean gain, which we denote by m-2m), and the silence control condition when we modulated song amplitude structure in a courtship song recording of a D. melanogaster male. We calculated P<0.0001 and F≈10.99 in a one-way ANOVA test, where nc=444 is the number of mixed-sex couples. (See Fig. 1B for an illustration of amplitude modulation in courtship-song recordings.) (C) D. melanogaster CS females preferred their own strain's amplitude envelope (m-m) over flat gain, steeper gain (m-2m), and the silence control condition when we modulated amplitude in an artificial D. melanogaster song. We calculated P<0.0001 and F≈18.33 in a one-way ANOVA with nc=228 mixed-sex couples. We show the distribution of the fraction of copulating pairs as grey kernel-density plots, which we mirror across the vertical axis and also show as box plots. A red cross indicates the mean, a horizontal line indicates the median, a box indicates the inter-quartile-range (IQR), and the whiskers indicate 1.5 × IQR. We calculated P<0.01 using two-sided Wilcoxon rank-sum (WR) tests, with Bonferroni correction for multiple testing; and we obtained P<0.025 using log-rank tests for comparing survival curves. The asterisks indicate a significant difference in the fraction of copulating pairs. The colour of the asterisks indicates which gain condition differs significantly from the others. The grey asterisks signifies that the grey condition (i.e. the m-2m envelope) differs significantly from the labelled condition (i.e. the D. melanogaster mean-gain envelope). The black asterisks indicate that the black condition (i.e. the flat gain) differs significantly from the labelled condition (i.e. the D. melanogaster mean-gain envelope). The black dots indicate that there is a significant difference in the fraction of copulating pairs between the labelled condition and the silence control; the P-value is P<0.01 (WR).

