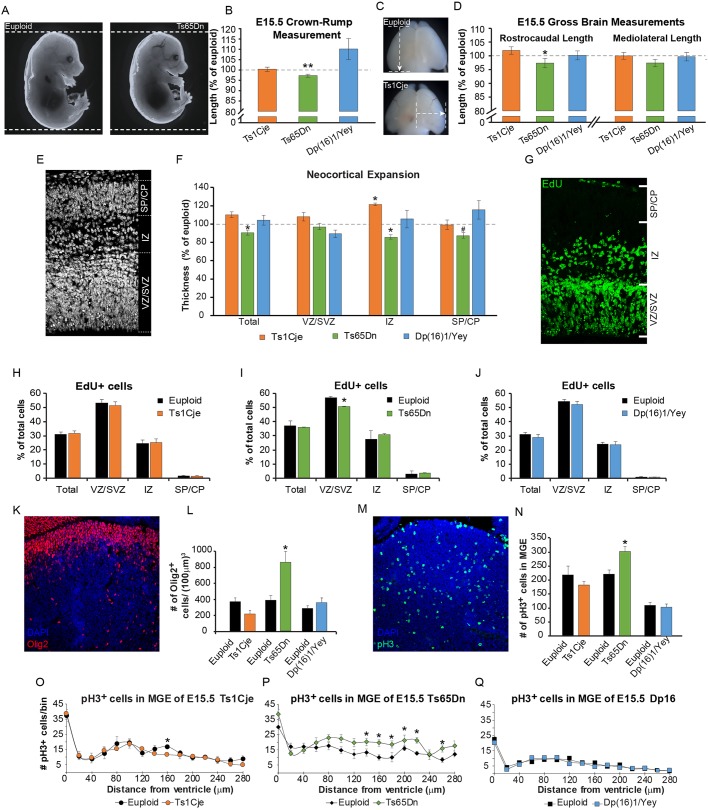
Fig. 2.
Embryonic somatic growth, brain development, and neurogenesis in Ts1Cje, Ts65Dn and Dp(16)1/Yey mice. All images and data are generated at the level of the future somatosensory cortex. Data are mean±s.e.m., *P<0.05, **P<0.01. (A) Representative images of euploid and Ts65Dn embryos at E15.5. (B) Quantification of body length in Ts1Cje, Ts65Dn and Dp(16)1/Yey embryos, showing only a decrease in Ts65Dn body length. Mice used: (1) Ts1Cje strain (n=13 trisomic mice, n=11 euploid littermates); (2) Ts65Dn strain (n=7 trisomic mice, n=20 euploid littermates); (3) Dp(16)1/Yey strain (n=26 trisomic mice, n=19 euploid littermates). (C) Representative images displaying the rostrocaudal (top) and mediolateral (bottom) measurements used to assess gross brain size at E15.5. (D) Gross brain measurements in Ts1Cje, Ts65Dn and Dp(16)1/Yey mice, showing that only Ts65Dn embryonic forebrains have a decreased rostrocaudal length. Mice used: (1) Ts1Cje strain (n=13 trisomic mice, n=11 euploid littermates); (2) Ts65Dn strain (n=7 trisomic mice, n=20 euploid littermates); (3) Dp(16)1/Yey strain (n=26 trisomic mice, n=19 euploid littermates). (E) Representative image showing the dorsal pallium in E15.5 brain. Dashed lines demarcate the different layers of the germinal zone: ventricular/subventricular zones (VZ/SVZ), intermediate zone (IZ) and subplate/cortical plate (SP/CP). (F) Measures of neocortical expansion in Ts1Cje, Ts65Dn and Dp(16)1/Yey forebrains as a percentage of those of their respective euploid littermates. Ts65Dn embryos show a decrease in overall pallial thickness, as well as thickness of the IZ and SP/CP (#P=0.10). Ts1Cje embryos show an increase in the size of the IZ that is not reflected in any other layer or in overall thickness. Dp(16)1/Yey embryos show no change. Mice used: (1) Ts1Cje strain (n=6 trisomic mice, n=6 euploid littermates); (2) Ts65Dn strain (n=9 trisomic mice, n=9 euploid littermates); (3) Dp(16)1/Yey strain (n=11 trisomic mice, n=10 euploid littermates). (G) Representative image showing EdU staining (green) in the dorsal pallium. Again, the layers of the dorsal germinal zone are demarcated. (H) Ts1Cje embryos show no change in the percentage of EdU+ cells by layer in the dorsal pallium compared with euploid littermates. (I) Ts65Dn embryos show a decrease in the percentage of EdU+ cells only in the VZ/SVZ of the dorsal pallium compared with euploid littermates. (J) Dp(16)1/Yey embryos show no change in the percentage of EdU+ cells by layer in the dorsal pallium compared with euploid littermates. (K) Representative image showing OLIG2 (red) staining in the medial ganglionic eminence (MGE) of the ventral germinal zone at E15.5. Cell nuclei are stained with DAPI (blue). Mice used in H-K: (1) Ts1Cje strain (n=6 trisomic mice, n=6 euploid littermates); (2) Ts65Dn strain (n=9 trisomic mice, n=9 euploid littermates); (3) Dp(16)1/Yey strain (n=11 trisomic mice, n=10 euploid littermates). (L) Number of OLIG2+ cells per 100 µm3 of MGE in Ts1Cje, Ts65Dn and Dp(16)1/Yey embryos and their respective euploid littermates. Only Ts65Dn mice show a marked increase in OLIG2+ cells compared with euploid littermates. Mice used: (1) Ts1Cje strain (n=6 trisomic mice, n=6 euploid littermates); (2) Ts65Dn strain (n=9 trisomic mice, n=9 euploid littermates); (3) Dp(16)1/Yey strain (n=11 trisomic mice, n=10 euploid littermates). (M) Representative image showing phosphorylated histone 3 (pH3) (green) staining in the MGE of the ventral germinal zone at E15.5. Cell nuclei are stained with DAPI (blue). (N) Number of pH3+ cells in the MGE of Ts1Cje, Ts65Dn and Dp(16)1/Yey embryos and their respective euploid littermates. Only Ts65Dn mice show a significant increase in pH3+ cells compared with euploid littermates. (O-Q) Distribution of pH3+ into 20-µm bins starting at the ventricular surface. (O) Ts1Cje mice show a decrease only in one bin at 160 µm from the ventricular surface compared with euploid littermates. (P) Ts65Dn show a consistent increase in the area corresponding to the SVZ of the MGE (bins 140-260 µm from the ventricular surface) compared with euploid littermates. (Q) Dp(16)1/Yey shows no change in pH3+ cells by bin compared with euploid littermates. Mice used in N-Q: (1) Ts1Cje strain (n=6 trisomic mice, n=6 euploid littermates); (2) Ts65Dn strain (n=9 trisomic mice, n=9 euploid littermates); (3) Dp(16)1/Yey strain (n=11 trisomic mice, n=10 euploid littermates).

