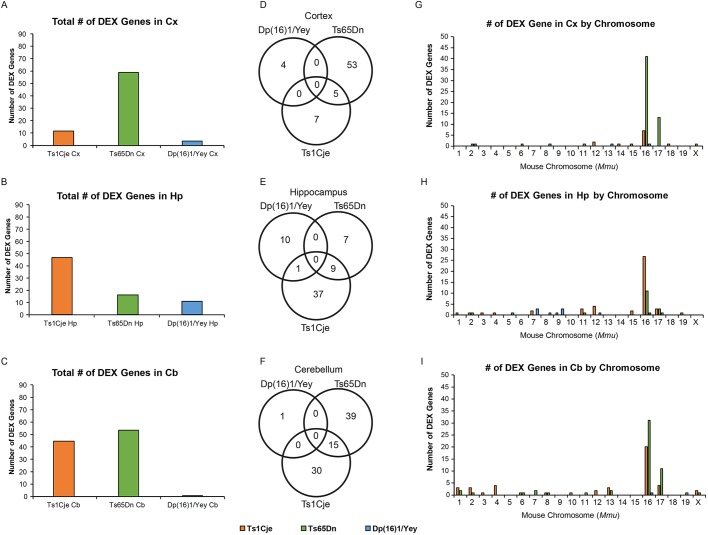
Fig. 7.
Number of DEX genes and their chromosomal clustering in adult Ts1Cje, Ts65Dn and Dp(16)1/Yey brains by region. Global gene expression analysis of cortex, hippocampus and cerebellum in adult male Ts1Cje mice (n=5 per genotype); Ts65Dn mice (n=5 per genotype); and Dp(16)1/Yey mice (n=5 per genotype). DEX genes were designated as such using a Benjamini-Hochberg FDR cut-off of <10%. (A-C) Overall number of DEX genes in each model by region. Dp(16)1/Yey mice display the lowest number of total DEX genes. Ts1Cje and Ts65Dn mice display a similar number of total DEX genes to one another, but these genes differ in identity and in chromosomal location in each model (G-I). (D-F) Venn diagrams showing the number of common DEX genes among the models by brain region. (G-I) Analysis showing genome-wide chromosomal clustering of DEX genes in Ts1Cje mice, Ts65Dn mice and Dp(16)1/Yey mice by brain region.

