Fig. 1.
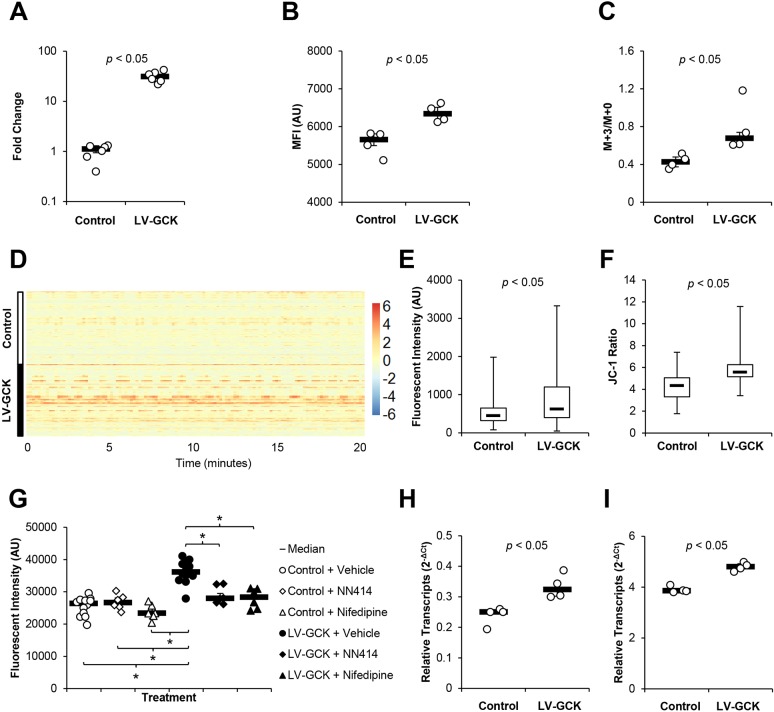
GCK increases glycolytic flux and enhances β-cell proliferation. GCK was overexpressed in Min6 cells by transduction with lentiviral vector expressing GCK under the mouse insulin 2 promoter (SIN-mIP2-GCK). (A) Densitometry analysis of immunoblot of nontransduced control Min6 cells and Min6 cells transduced with lentiviral vector SIN-mIP2-GCK. (B) Mean fluorescent intensity (MFI; in arbitrary units, AU) of Min6 cells as measured by flow cytometry following overnight incubation with fluorescent glucose analog 2-deoxy-2-[(7-nitro-2,1,3-benzoxadiazol-4-yl)amino]-D-glucose (2-NBDG) (n=4 per group). (C) Ratio of 13C-labeled lactate to unlabeled lactate following overnight incubation with U-13C6 D-glucose was measured by gas chromatography mass spectrometry (GC/MS) (n=4 per group). (D) Single-cell Ca2+-dependent RCaMP1h fluorescent intensity trace (n=210-213 per group). Color scale indicates z-scores normalized per time frame. (E) Fluorescent image analysis of median Ca2+-dependent RCaMP1h fluorescent intensity during the trace shown in D. (F) JC-1 ratio of nontransduced control Min6 cells and Min6 cells overexpressing GCK was determined using a JC-1 Mitochondrial Membrane Potential Assay Kit (Cayman Chemical). (G) Relative cell numbers following incubation with vehicle, NN414 or nifedipine was determined using the CyQUANT NF Proliferation Assay (Thermo Fisher Scientific) 2 days after seeding (n=6-12 per group). (H) Relative expression of Irs2 transcripts in nontransduced control and GCK-overexpressing Min6 cells (n=4 per group). (I) Relative expression of Ccnd2 transcripts in nontransduced control and GCK-overexpressing Min6 cells (n=4 per group). Results are shown as scatter plots with medians (black bars)±MAD, heatmap or box plots. Whiskers represent minimum and maximum values. *P<0.05.

