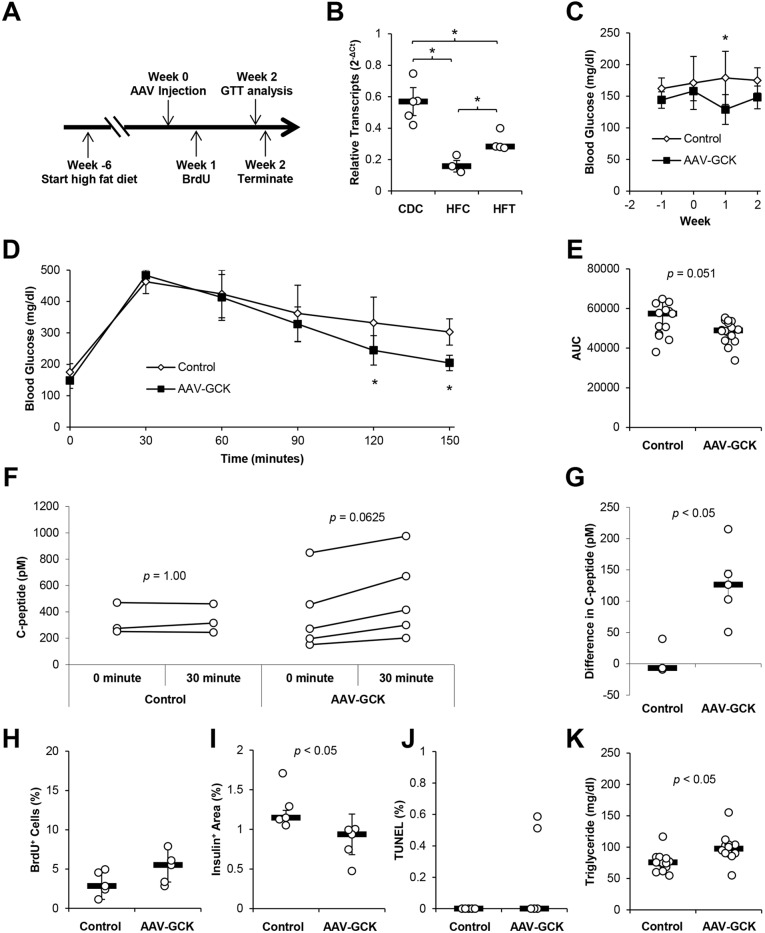
Fig. 4.
Increased GCK expression in HFD-induced diabetes restores β-cell function and improves glucose tolerance. (A) HFD was fed ad libitum for at least 6 weeks prior to AAV injection. Mice were given PBS control or 3.3×10¹³ AAV-mIP2-GCK genome copy (gc)/kg body weight via intraperitoneal injections. BrdU was administered through drinking water ad libitum 1 week after AAV injection. IPGTT was performed 2 weeks following AAV injection. Mice were then killed for analysis. (B) Relative expression of Gck transcripts in isolated islets 2 weeks after AAV injection. CDC, chow diet controls; HFC, HFD controls; HFT, HFD treated. (C) Weekly blood glucose was measured following a 6-h fast. (D) IPGTT after a 6-h fast 2 weeks following AAV delivery (n=16-18 per group). (E) Area-under-the-curve analysis of IPGTT shown in D (n=16-18 per group). (F) Plasma C-peptide before and 30 min after injection of glucose during IPGTT (n=3-5 per group). (G) Difference between circulating C-peptide before and 30 min after injection of glucose during IPGTT (n=3-5 per group). (H) Insulin+ BrdU+ cells as a percentage of insulin+ cells was counted from fluorescent confocal microscopy images of mouse pancreas sections (n=5 per group). (I) Insulin+ area as a percentage of total pancreas area was determined by anti-insulin HRP staining of mouse pancreas sections (n=5 per group). (J) Percentage of TUNEL+ insulin+ cells was counted from fluorescent confocal microscopy images of mouse pancreas sections (n=5 per group). (K) Plasma triglyceride concentration was measured 2 weeks after vector injection (n=12-13 per group). Results are shown as scatter plots with medians (black bars)±MAD or line graphs with medians±MAD, *P<0.05.

