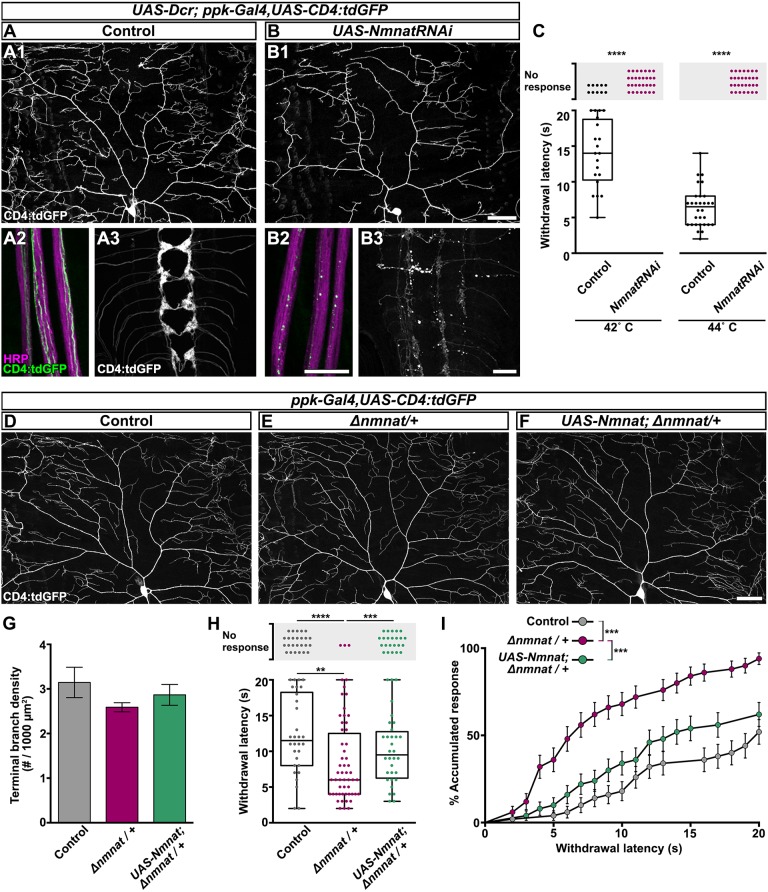
Fig. 5.
Nmnat is required for maintenance of nociceptive integrity. (A1-B3) Confocal projections of neuronal compartments labeled with CD4:tdGFP from control genotype (A) and larvae with RNAi-mediated C4da neuronal knockdown of Nmnat (UAS-NmnatRNAi; B) at 120 h AEL. Nmnat knockdown decreases dendritic branch complexity (B1), leads to axon degeneration (B2) and results in overt loss of synaptic terminals in the ventral nerve cord (B3). HRP labels all axonal membranes in peripheral nerve bundles (A2,B2). Dendrite scale bar: 50 µm; axon and VNC scale bars: 20 µm. (C) Withdrawal response of control genotype larvae and larvae with RNAi-mediated C4da Nmnat knockdown at 42 or 44°C stimulation. Each data point represents one larva. n=30 larvae tested at each temperature, Mann–Whitney test for response rate. (D-F) Representative confocal projections of C4da dorsal dendrites labeled with CD4:tdGFP from larvae of control genotype (D), heterozygous for Nmnat (E; Δnmnat/+), and heterozygous for Nmnat with C4da overexpression of Nmnat (F; UAS-Nmnat; Δnmnat/+) at 120 h AEL. Scale bar: 50 µm. (G) Quantification of terminal branch density from larvae of control genotype, Nmnat heterozygotes, and Nmnat heterozygotes with C4da overexpression of Nmnat. Mean±s.e.m.; n≥6 neurons from >4 larvae, one-way ANOVA. (H) Withdrawal response of larvae of control genotype, Nmnat heterozygotes, and Nmnat heterozygotes with C4da overexpression of Nmnat at 42°C stimulation. n=55 larvae tested from each group, Kruskal–Wallis with Dunn's multiple comparisons test for response rate and mean withdrawal latency. **P<0.01, ***P<0.001, ****P<0.0001. (I) Cumulative distribution of latency curve of larval withdrawal responses in H. This graph plots the accumulated percent response as a function of withdrawal latency, providing a curve that fits all of the larvae tested, both those that respond aversely and those that do not perceive noxious stimulation within the 20 s cutoff. Each pair of groups is initially compared by log-rank (Mantel–Cox) test and adjusted for multiple comparisons by Bonferroni-corrected threshold (Bonferroni-corrected threshold=family-wise significance level/K, where K is the number of comparisons). When the P-value of Mantel–Cox test comparing two curves is <the Bonferroni-corrected threshold of 0.05/3=0.0167 or 0.001/3=0.00033, the comparison is considered statistically significant. ***P<0.00033.

