
Fig. 1. A schematic diagram of the analysis process.
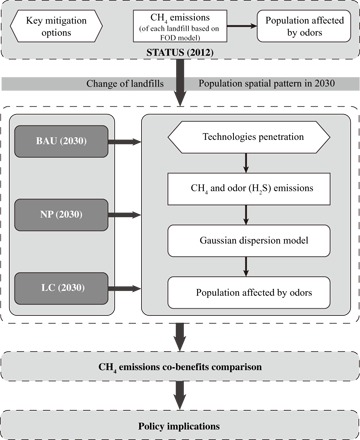
The BAU, NP, and LC represent three scenarios in 2030. FOD, first-order decay.
Official websites use .gov
A
.gov website belongs to an official
government organization in the United States.
Secure .gov websites use HTTPS
A lock (
) or https:// means you've safely
connected to the .gov website. Share sensitive
information only on official, secure websites.
The BAU, NP, and LC represent three scenarios in 2030. FOD, first-order decay.