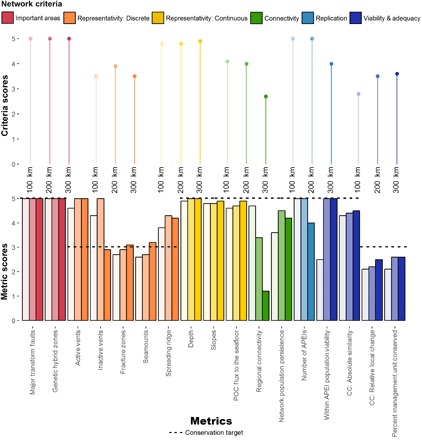
Fig. 3. APEI network performance assessment (nMAR management subunit).

Bottom: Scores for 17 metrics derived to capture performance (5 being the best) of scenarios against the five CBD network criteria (see legend for color code; light shading, 100-km scenario; medium shading, 200-km scenario; dark shading, 300-km model). Table 1 defines the metrics and metric equations. Table S2 shows the raw values and commentary. Dotted line, conservation targets for each score; CC, climate change. Top: Summary scores for each network criterion (calculated by taking the average scenario score of the metrics for a criterion). Scenario core lengths are provided on the x axis.
