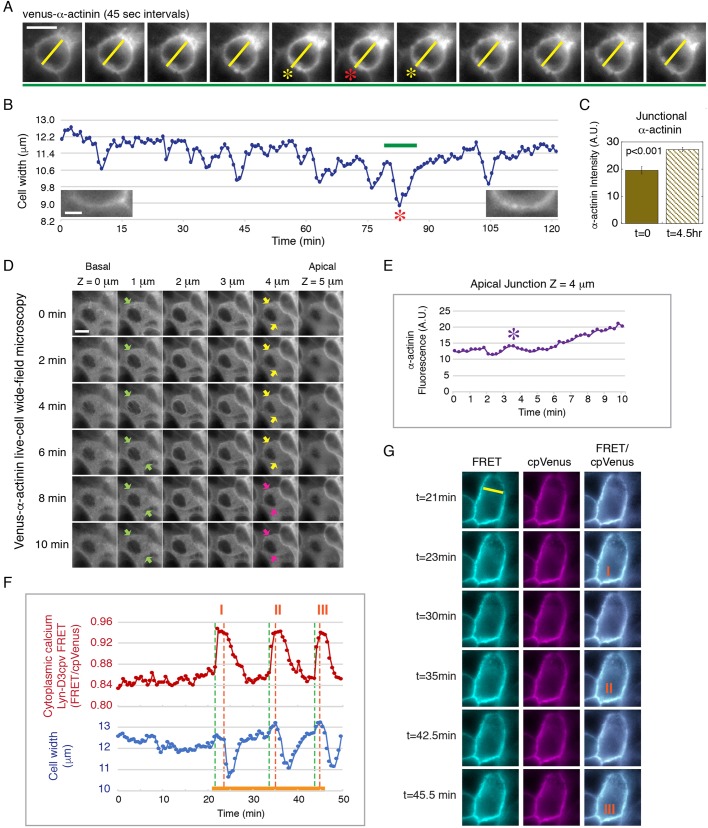
Fig. 1.
Recruitment of α-actinin during junction maturation is associated with endogenous epithelial cell contraction. (A) Time-lapse frames from Movie 1 showing the transient decrease in cell width as marked by Venus–α-actinin during a whole-cell contraction in a maturing cell monolayer (red and yellow asterisks). The yellow line marks the cell width. Data are representative of six sets of live-cell time-lapse movies. Scale bar: 10 µm. (B) Measurements of cell width of the contracting cell shown in A and Movie 1. The green bar marks the time sequence shown in A. The red asterisk corresponds to the contraction shown in A. Left and right insets show junctional Venus–α-actinin at t=0 min and t=120 min, respectively. Scale bar: 2 µm. (C) Quantification of the level (A.U., arbitrary units) of junctional Venus–α-actinin of the cell shown in A,B at t=0 and t=4.5 h. Bar graph shows the mean±s.e.m. of six separate junctional regions of the contracting cell. P<0.001 for α-actinin between t=0 and 4.5 h. Data are representative of six sets of live-cell time-lapse movies. (D) Time-lapse frames from Movie 2 showing whole-cell contraction along the lateral membrane (apical z=5 µm to basal z=0 µm) in a young monolayer with no original accumulation of α-actinin at the apical junction (yellow arrows). Pink arrows point to increasing Venus–α-actinin accumulation at the apical junction after contraction. Green arrows mark the lateral cell boundary of the contracting cell. Data are representative of 12 sets of live-cell time-lapse movies. Scale bar: 10 µm. (E) Measurements of the cell shown in D and Movie 2. The level of Venus–α-actinin at the apical junction (z=4 µm) gradually increases after the initial contraction (purple asterisk). (F) Cell width and intracellular Ca2+ concentration measured using the lipid-modifiable intramolecular FRET sensor Lyn-D3cpV (from Movie 3). Whole-cell contraction is preceded by a Ca2+ spike and characterized by the inward movement of the lateral plasma membrane. Orange solid line marks the time-lapse sequence shown in G. Three contraction events are shown (I, II, III), corresponding to the labeled images in G. The green dotted line represents the beginning of a Ca2+ spike; the orange dotted line represents the beginning of contraction. The Ca2+ spike is indicated by a change in the ratio of FRET to cpVenus. (G) Time-lapse frames from Movie 3 showing three Ca2+ spikes, corresponding to the three contraction events in F (marked by orange I, II, III). Lyn-D3cpV FRET (excitation of donor and emission of acceptor), cpVenus (excitation of acceptor and emission of acceptor contraction) and merge images of FRET and cpVenus are shown. Data are representative of six sets of live-cell time-lapse movies.

